

This story describes the technical details of the problems that caused the Slack downtime on May 12th, 2020. To learn more about the process behind incident response for same outage, read Ryan Katkov’s post, “All Hands on Deck”.
On May 12, 2020, Slack had our first significant outage in a long time. We published a summary of the incident shortly after, but this story is an interesting one, and we’d like to go into more detail on the technical issues around it.
The user-visible outage began at 4:45pm Pacific time, but the story really begins around 8:30am that morning. Our Database Reliability Engineering team was alerted for a significant load increase in part of our database infrastructure at the same time as our Traffic team received alerts that we were failing some API requests. The increased load on the database was due to a rollout of a configuration change, which triggered a longstanding performance bug. The change was quickly pinpointed and rolled back — it was a feature flag which performed a percentage-based rollout, so this was a fast process. We had some customer impact, but it lasted only for three minutes and most users were still able to send messages successfully throughout this brief morning incident.
One of the incident’s effects was a significant scale-up of our main webapp tier. Our CEO Stewart Butterfield has written about some of the impact of the lockdown and stay-at-home orders on Slack usage. As a result of the pandemic, we’ve been running significantly higher numbers of instances in the webapp tier than we were in the long-ago days of February 2020. We autoscale quickly when workers become saturated, as happened here — but workers were waiting much longer for some database requests to complete, leading to higher utilization. We increased our instance count by 75% during the incident, ending with the highest number of webapp hosts that we’ve ever run to date.
Everything seemed fine for the next eight hours — until we were alerted that we were serving more HTTP 503 errors than normal. We spun up a new incident response channel and the on-call engineer for the webapp tier manually scaled up the webapp fleet as an initial mitigation. Unusually, this didn’t help at all. We very quickly noticed that a subset of the webapp fleet was under heavy load while the rest of the webapp instances were not. Multiple strands of investigations began, looking into both webapp performance and our loadbalancer tier. A few minutes later, we identified the problem.
We use a fleet of HAProxy instances behind a layer 4 load-balancer to distribute requests to the webapp tier. We use Consul for service discovery, and consul-template to render lists of healthy webapp backends that HAProxy should route requests to.
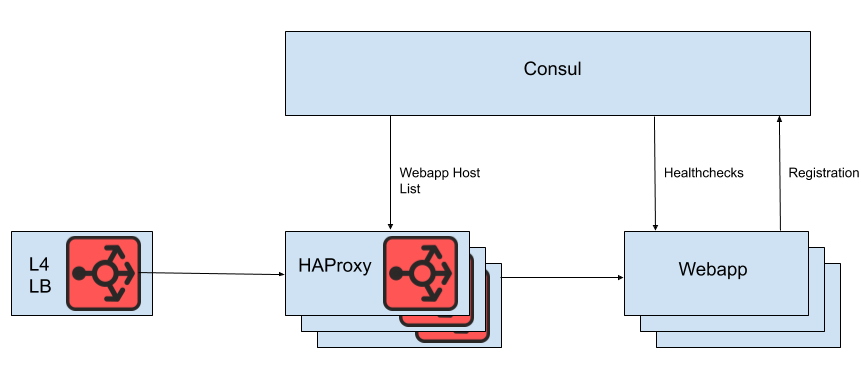
We don’t render our webapp host list directly into our HAProxy configuration file, however. The reason for this is that updating the host list via the configuration file requires reloading HAProxy. The process of reloading HAProxy involves creating a brand-new HAProxy process while keeping the old one around until it’s finished dealing with in-flight requests. Very frequent reloads could lead to too many running HAProxy processes and poor performance. This constraint is in tension with the goal of autoscaling the webapp tier, which is to get new instances into service as quickly as possible. Therefore, we use HAProxy’s Runtime API to manipulate the HAProxy server state without doing a reload each time a web tier backend comes into or goes out of service. It’s worth noting that HAProxy can integrate with Consul’s DNS interface, but this adds lag due to the DNS TTL, it limits the ability to use Consul tags, and managing very large DNS responses often seems to lead to hitting painful edge-cases and bugs.
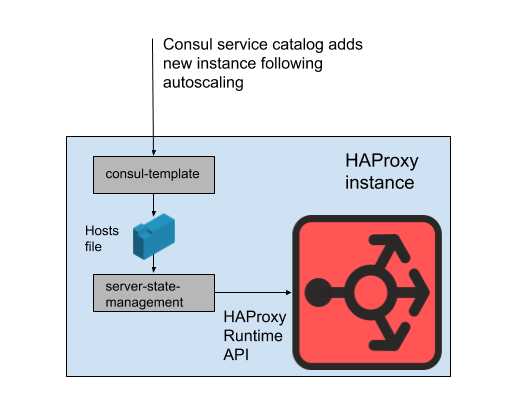
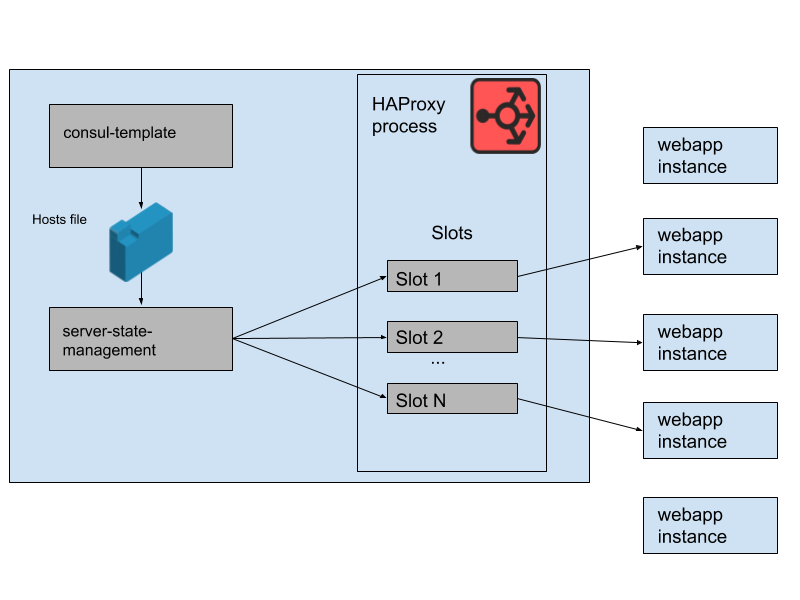
We define HAProxy server templates in our HAProxy state that are effectively ‘slots’ which our webapp backends can occupy. When a new webapp instance is provisioned, or an old one becomes unhealthy, the Consul service catalog is updated. Consul-template renders a new version of the host list, and a separate program developed at Slack, haproxy-server-state-management, reads that host list and uses the HAProxy Runtime API to update the HAProxy state.
We run M parallel pools of HAProxy instances and webapp instances, each pool in its own AWS Availability Zone. HAProxy is configured with N ‘slots’ for webapp backends in each AZ, giving a total of N * M backends that can be routed to across all the AZs. A few months ago, this total was more than ample headroom — we’d never needed to run anything even approaching that number of instances of our webapp tier. However, after the morning’s database incident, we were running slightly more than N * M instances of the webapp. If you think of the HAProxy slots as a giant game of musical chairs, a few of these webapp instances were left without a seat. That wasn’t a problem — we had more than enough serving capacity.
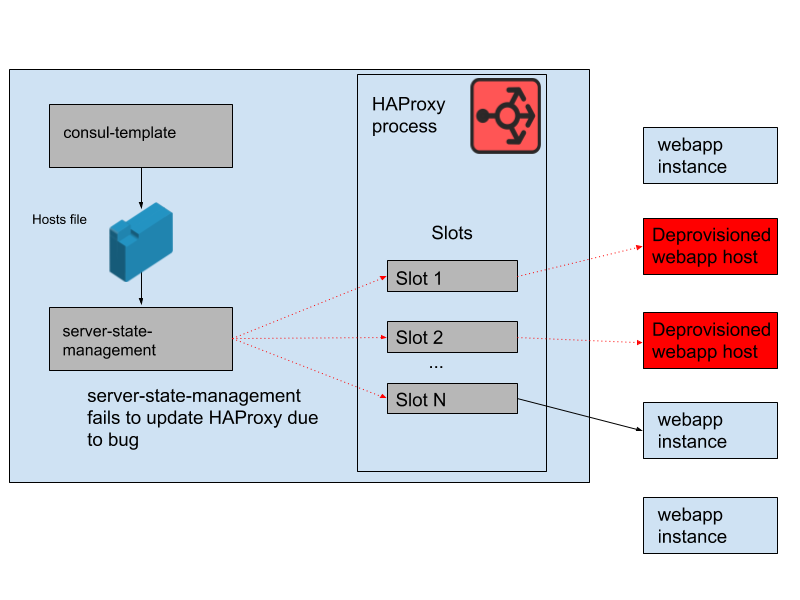
However, over the course of the day, a problem developed. The program which synced the host list generated by consul template with the HAProxy server state had a bug. It always attempted to find a slot for new webapp instances before it freed slots taken up by old webapp instances that were no longer running. This program began to fail and exit early because it was unable to find any empty slots, meaning that the running HAProxy instances weren’t getting their state updated. As the day passed and the webapp autoscaling group scaled up and down, the list of backends in the HAProxy state became more and more stale.
By 4:45pm Pacific, most HAProxy instances were only able to send requests to the set of webapp backends that had been up since the morning, and this set of older webapp backends was now a minority of the fleet. We do regularly provision new HAProxy instances, so there would have been a few fresh HAProxy instances that had correct configuration, but most of them were more than eight hours old and therefore were stuck with full and stale backend state. The outage was eventually triggered at the end of the business day in the US because that’s when we begin to scale down the webapp tier as traffic drops. Autoscaling will preferentially terminate older instances, so this meant that there were no longer enough older webapp instances remaining in the HAProxy server state to serve demand.
Once we knew the cause of the failure, it was resolved quickly with a rolling restart of the HAProxy fleet. After the incident was mitigated, the first question we asked ourselves was why our monitoring didn’t catch this problem. We had alerting in place for this precise situation, but unfortunately, it wasn’t working as intended.The broken monitoring hadn’t been noticed partly because this system ‘just worked’ for a long time, and didn’t require any change. The wider HAProxy deployment that this is part of is also relatively static. With a low rate of change, fewer engineers were interacting with the monitoring and alerting infrastructure.
The reason that we haven’t been doing any significant work on this HAProxy stack is that we’re moving towards Envoy Proxy for all of our ingress load-balancing (we’ve recently moved our websockets traffic onto Envoy). While HAProxy has served us well and reliably for many years, it also has some operational sharp edges, of exactly the kind highlighted by this incident. The complex pipeline we use to manipulate HAProxy server state will be replaced by Envoy’s native integration with an xDS control plane for endpoint discovery. The most recent versions of HAProxy (since the 2.0 release) also solve many of these operational pain points. However, Envoy has been our proxy of choice for our internal service mesh project for some time, and this makes a move to Envoy for our ingress load-balancing attractive. Our initial testing of Envoy + xDS at scale is very exciting and this migration should improve both performance and availability going forward. Our new load-balancing and service discovery architecture is not susceptible to the problem that caused this outage.
We strive to keep Slack available and reliable, and in this case, we failed. We know that Slack is a critical tool for our users, and that is why we aim to learn as much as we can from every incident, whether customer visible or not. We apologize for the inconvenience this outage caused and will continue to use the lessons learned to drive improvements in both our systems and our processes.