

This story speaks to the process behind incident response at Slack and uses the May 12th, 2020 outage as an example. For a deeper technical review of the same outage, read Laura Nolan’s post, “A Terrible, Horrible, No-Good, Very Bad Day at Slack”
Slack is a critical tool for millions of people, so it’s natural when Slack going down can feel as stressful as when our power goes out, when the internet stops working, or when our smartphone runs out of battery. What does Slack do when Slack goes down?
On those rare times we suffer a total service disruption, the response is, essentially, All Hands on Deck. This happened on the afternoon of May 12th, 2020 at 4:45pm Pacific, which started as a normal day like any other at Slack. This is the story of that day, who was involved in the effort to restore Slack service, and, chiefly, what that process looks like. We hope it gives insights into the machinery, both human and computational, that runs Slack for our millions of customers.
8:45AM, May 12th, 2020
Slack normally deploys software and configuration changes on a cycle each day. That morning it was business as usual, and we deployed a set of pull requests to our production environment. But suddenly, something was amiss. We saw a surge in requests against our Vitess database tier that serves user data and some customers began to experience sporadic errors. In order to accommodate the increased, unexpected demand, our API service automatically scaled up 80%. Within 13 minutes, the problem was remediated by a rollback of the code, and we scaled back down to normal host counts some time later.
The day went on as usual for all of us at Slack, until 4:45PM.
4:26PM
During one of our normal deploy operations, engineers noticed a surge of errors in dashboards used to monitor deploys. Questions were raised. Messages were posted in channels. Soon, alerts started to go off. It was clear there was a serious problem.
Our incident response begins when someone invokes our custom built Incident Bot with an “/assemble” slash command, which in turn pages critical responders in Engineering and Customer Experience via PagerDuty.
Before we move on with our story, it’s worth doing a short overview of Slack’s Incident Response process. We’ve spent well over a year developing and tuning the process to ensure we can rapidly recover from incidents and strive for industry-leading reliability.
Major Incident Command
Slack has grown rapidly in the last six years, and at first, our incident process didn’t evolve to keep pace. Once upon a time, there was an on-call rotation staffed with operations engineers, coined AppOps, short for Application Operations. This was the rotation that would always get paged for Slack troubles and be responsible for fixing Slack. They tirelessly responded to every page, kept Slack up, and moved on with their day.
It became clear that as the company and Slack’s usage grew, this hardy, heroic rotation could not keep up with the volume of incidents, nor could they amass the knowledge required to maintain operational awareness of each of Slack’s growing services. They could not, as a limited set of humans, sustain the pressure and toil of such a high-stress, on-call rotation.
In 2018, Reliability Engineering came into the picture and established an incident response process that was modeled around FEMA’s Incident Response guidelines. As a result, the AppOps group on-call was disbanded, each development team at Slack became responsible for their own services via team on-call rotations, and the Major Incident Command was staffed by engineers trained to facilitate incident response. Reliability Engineering is responsible for the program material, the training courses, and ensures that the process is smooth and has full participation throughout the company. Each Incident Commander, traditionally, is not hands-on-keyboard, but is responsible for facilitation, information gathering, resource gathering, response coordination and decision making.
The Incident Timeline 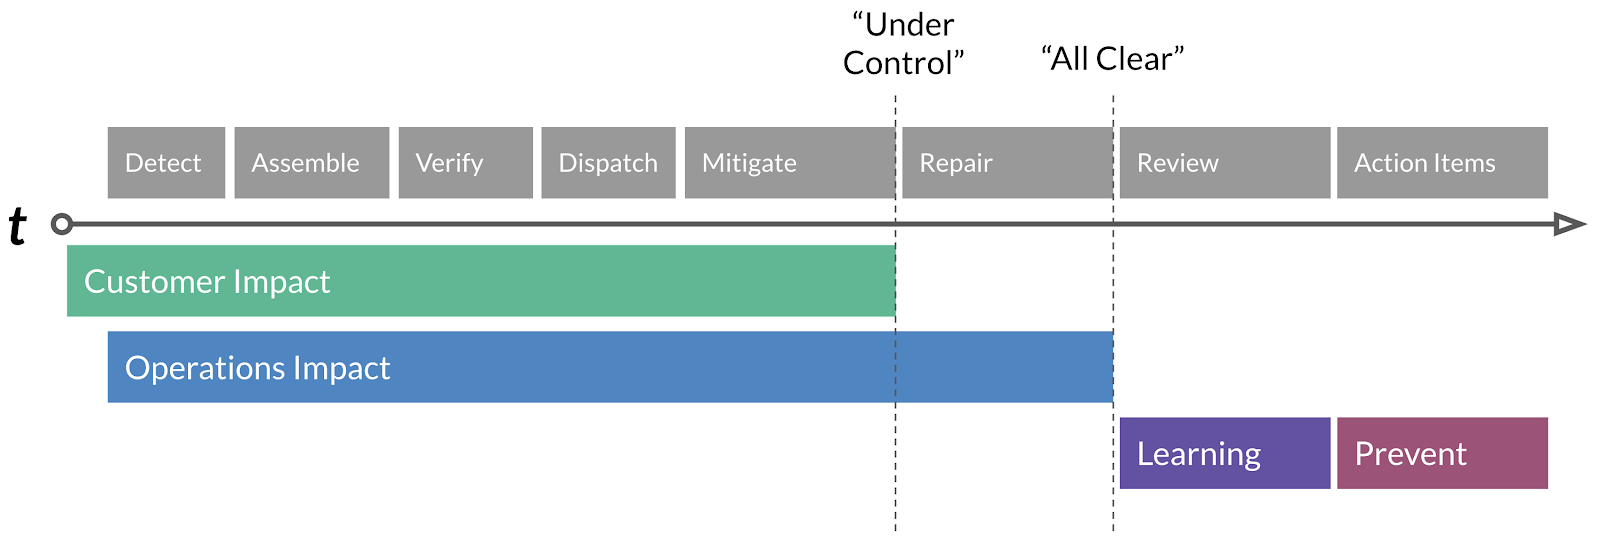
The timeline of an incident is composed of four distinct stages, Customer Impact, Operations Impact, Learning & Prevention. Within these stages, there are distinct operations that lead to the final resolution of an incident, which we’ll briefly summarize.
Detect: Detection of a regression or customer impact via, ideally, SLO failure, automated alerts driven by metrics, or less ideally, customer reports.
Assemble: The Subject Matter Expert (SME) who gets the initial Detect page will invoke the Assemble process and alert the Incident Commander on-call.
Verify: Incident Commander discusses with SME on initial scope of the impact as well as severity. Our first Conditions, Actions and Needs (CAN) reports can begin.
Dispatch: Incident Commander, based on the CAN report, will page additional SME’s as needed.
Mitigate: A diagnosis is presented, and a mitigation action is proposed & executed.
Repair: Typically, mitigations are temporary — an analogy would be duct-taping a leak. The repair action is a long term fix if needed.
Review: The Incident Review process kicks off and we review the incident and extract lessons and action items from it.
Action Items: We complete action items based on priority within defined SLA’s to further enhance prevention of the incident recurring.
Nearly every well-run incident can fit into the model above, and this particular incident was no exception.
4:45PM
Even though the incident response process started 19 minutes prior to the full outage, we were not yet completely aware that we were headed into a full outage. At the time, responders from our edge and load balancing traffic team, and our web infrastructure service team were still gathering information, collecting signals from dashboards and attempting to drill down the root cause of the alerts. Our Customer Experience teams, which are always closely aligned with our Incident Response process, were reporting incoming tickets describing customer trouble in real-time. All signals pointed to problems in our main web service tier, serving Slack’s API. The load balancers were reporting timeouts on the health checks to each API instance and thus removing them from service. Our instrumentation showed that API response times were elevated, as a result of the web workers being heavily loaded.
4:51PM
One of the responders declares, “we’re about to go offline, we just lost all main_wwws in the webapp pool”. This is the moment where you feel the blood drain from your face.
What does Slack do when Slack goes down?
In such unfortunate situations where we aren’t able to rely on Slack, we have prescribed alternative methods of communication. Following incident runbooks, we quickly moved to the incident Zoom and elevated the response to a Sev-1, our highest severity level. Executives were paged, per the runbook. A company-wide email was sent out, with links to department specific runbooks for full site outages. Our real-time client instrumentation, which sends telemetry to an isolated endpoint, showed that success rate on the clients had dipped to abysmal levels. It was all hands on deck at this point.
4:58PM
Engineers from different teams joined on the Zoom call, scribes were recording the conversation on Zoom for later dissemination, opinions and solutions were offered. Graphs and signals were shared. It’s a flurry of action and adrenaline that the Incident Commander must guide and keep the right people focused so that the most appropriate action can be taken, balancing risk vs. restoring service. Multiple workstreams of investigation were established and assigned with the goal of bringing remediation in the most efficient manner.
The process continues until a resourceful human finds the right answer.
5:17PM
At this point, our investigation was pointing to issues in the configuration for our HAProxy load balancing tiers. Something didn’t add up. We use a combination of consul-template and a bespoke HAProxy management service to maintain the manifest of active servers for our web service backend. There were servers in the manifest that weren’t supposed to be there. Soon, it became clear we had stale HAProxy configuration files, as a result of linting errors preventing re-rendering of the configuration.
An engineer proposed that we stop HAProxy, delete its state file, restart consul-template to refresh the manifest and restart HAProxy. There was a consensus on this being the most correct course of action and two engineers set off to test the hypothesis. The hypothesis proved correct as a control portion of servers began to once again report healthy and receive traffic. The engineers then used automation to safely execute the prescribed set of commands across our availability zones.
5:33PM & Under Control
We saw near-immediate relief from the actions. 48 long minutes after the start of the outage, our remediation efforts were successful and Slack’s service was restored. Our Customer Experience experts declared reports of happy customers. Our Incident Commander declared “Under Control” at this point which is a signal that remediation was successful and that we should begin work towards the final state, “All Clear”.
All Clear
In order to bring the incident to a close and declare an All Clear, the Incident Commander must review the current signals, pose questions to engineers such as, “What are the risks of recurrence?” or “Do we have appropriate alerting in place?”. In this case, part of the all-clear work also involved restoring the state of the Slack desktop client which we discovered experienced a regression as a result of this outage, requiring a restart to restore service. Frontend Foundations engineers consulted with Customer Experience on the best course of action to do so, and CE set upon to notify their customers of the workaround.
When it was apparent that most customer tickets had reached resolution, our metrics indicated stability for some time, and the engineers agreed that recurrence would not occur, the Incident Commander called All Clear.
The Incident Review
The All Clear isn’t the end and it isn’t job-well-done and back-pats for everyone. The cornerstone of every incident response process is the Feedback Loop: a system of failure, remediation, learning and repair that allows engineering teams to apply targeted pressure at problem areas to ensure that incidents don’t recur. The remediation has been completed here, thus begins the learning.
The incident review is a ceremony practiced in many engineering circles that gives engineers a psychologically safe space to discuss and learn from an incident. The Feedback Loop continues after the meeting where action items are created, assigned to teams, and given a priority so they are completed on schedule.
A successful incident response process generates a positive feedback loop, improving knowledge and understanding of your complex systems and how they fail, driving down technical debt and risk of change, and ultimately reducing the blast radius of incidents and increasing the reliability of your service.