

Digging through a large codebase to locate a bug can feel incredibly overwhelming, especially for a junior developer. While some might argue that well-placed print statements are just as efficient, getting to know the ins and outs of a debugging interface can save a significant amount of head-scratching and help you navigate tricky bugs more efficiently.
I’m currently a rising senior at UC Berkeley working as an intern on the Slack Platform Services team, where we aim to improve the experience for those developing apps on Slack through our web and events APIs. Many of my features have little to no visual component, and the variability of user input is high — this is the nature of working on APIs. As such, writing thorough unit tests is critical to each feature’s success, but that also means much of my time is spent debugging code.
Here at Slack, we use Hack on HHVM, which is especially useful when writing strongly-typed code to support variable payload structures in API calls. What follows is a guide to fully utilizing some key debugging tools for HHVM in VSCode that I’ve found most helpful in my day-to-day workflow. This advice is extensible to most other debuggers and languages as well. Regardless of your own personal development workflow, using a debugging interface will help you save time and code smart.
Diving Deeper
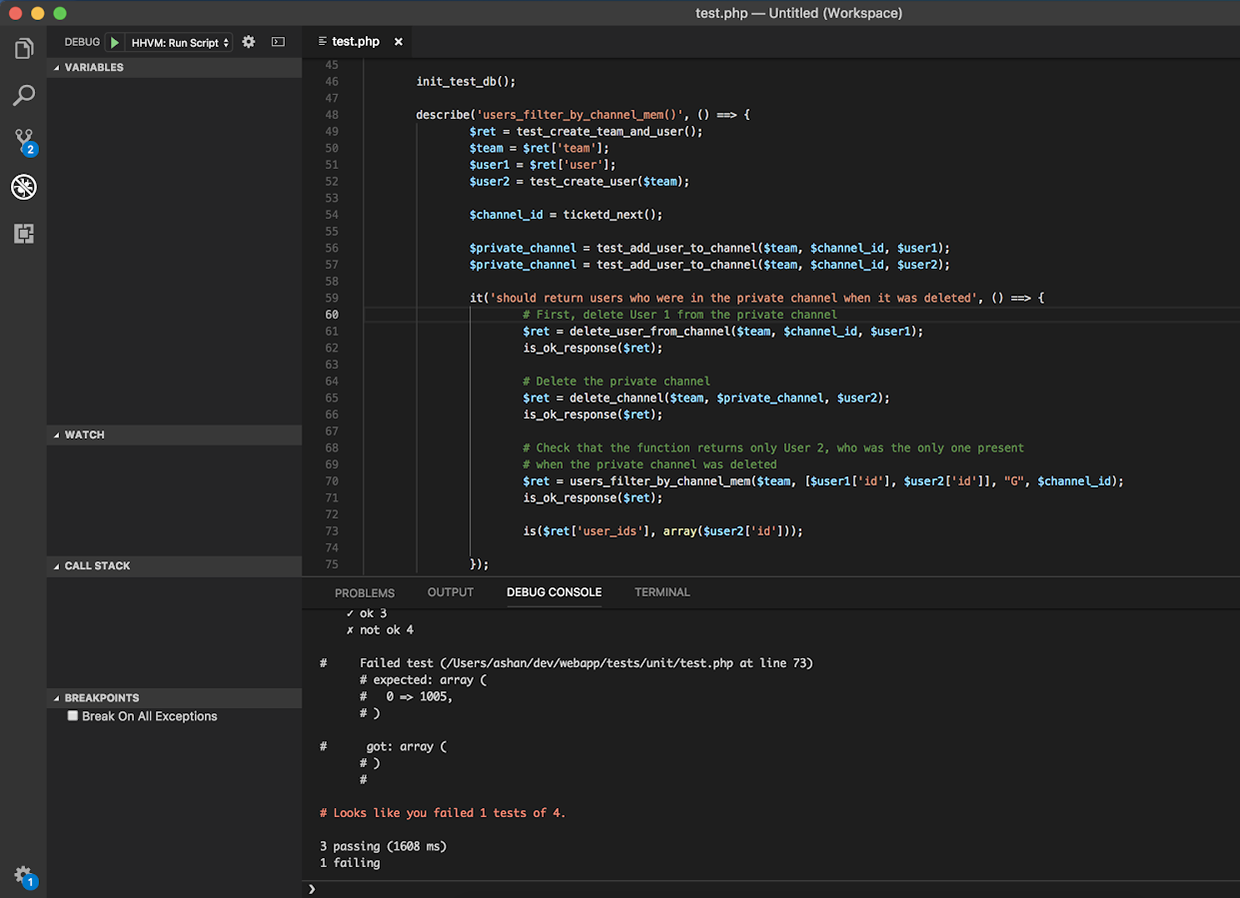
Recently, I was working on adding a new event type through the Slack Events API that would allow apps and bots to be notified when a private channel is deleted. I created a unit test to check that users_filter_by_channel_membership would return the correct users to receive the notification — in this case, the users who were present in the private channel at the time it was deleted. The seemingly straightforward test failed after I pushed it to our Continuous Integration environment. Luckily, I was able to use the debugger to quickly identify and fix the problem. In the sections that follow, I’ll walk through the most useful aspects of the VSCode HHVM debugger that helped me in this process.
Breakpoints
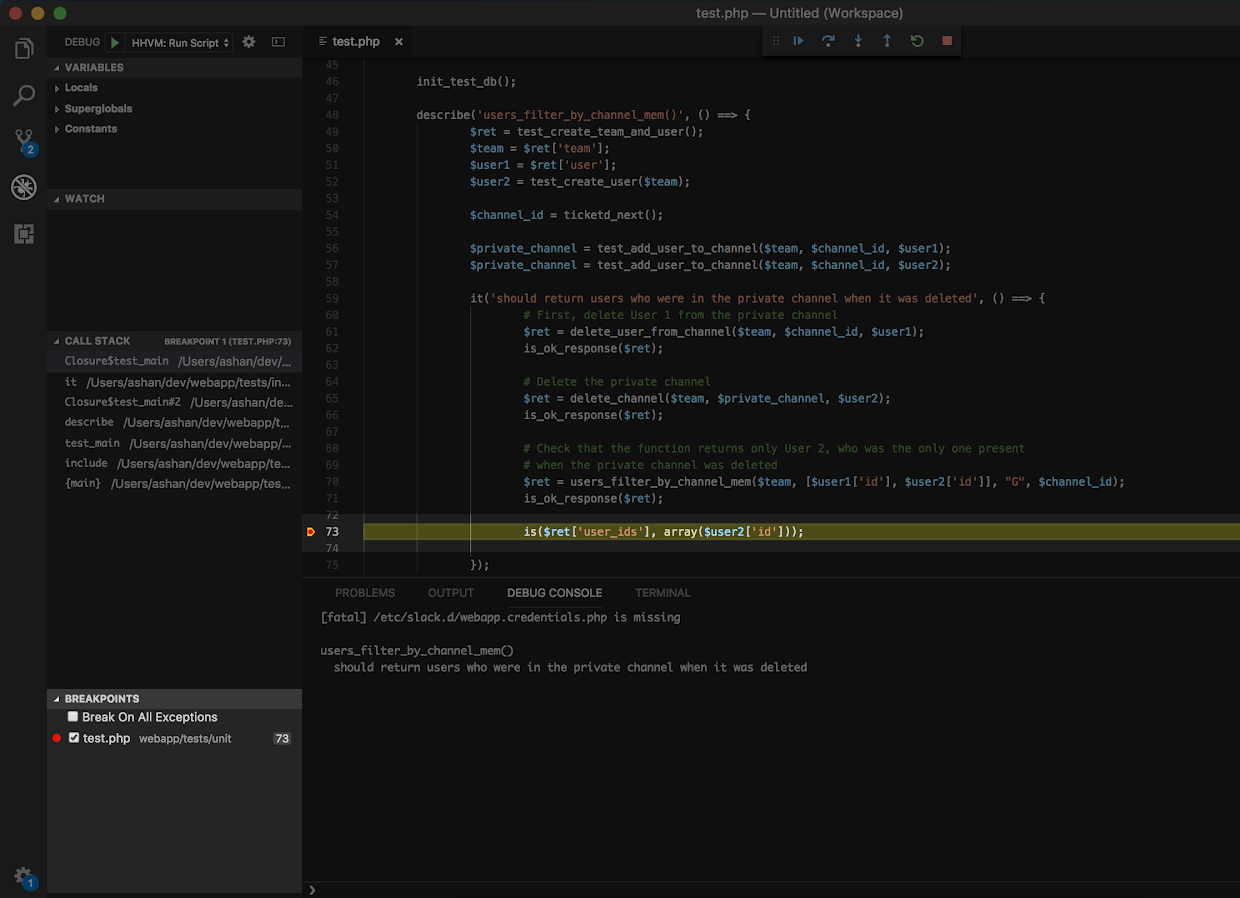
Breakpoints are the backbone of debugging. Setting a breakpoint on the line a test fails allows you to pause execution at that moment and utilize the debugging toolbar to step into the function and explore its behavior more closely.
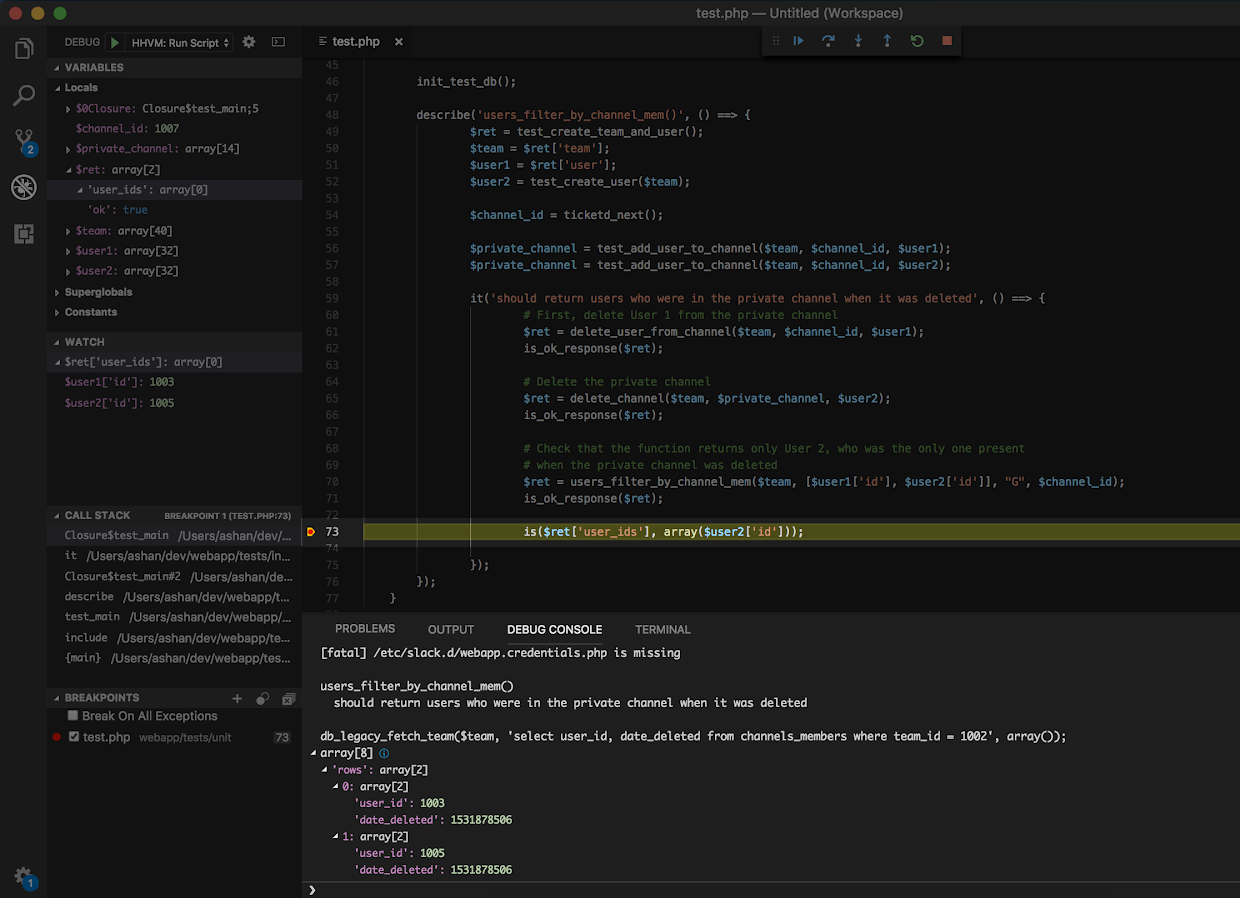
In this example, I set the breakpoint on line 73 by clicking the margin to the left of the line number, where the assertion fails. The Breakpoints menu shows a list view of all the breakpoints set across the codebase and allows you to control the order of execution for your breakpoints by toggling them on and off. Once you’ve set your breakpoints, you can take advantage of the other tools below.
Variables
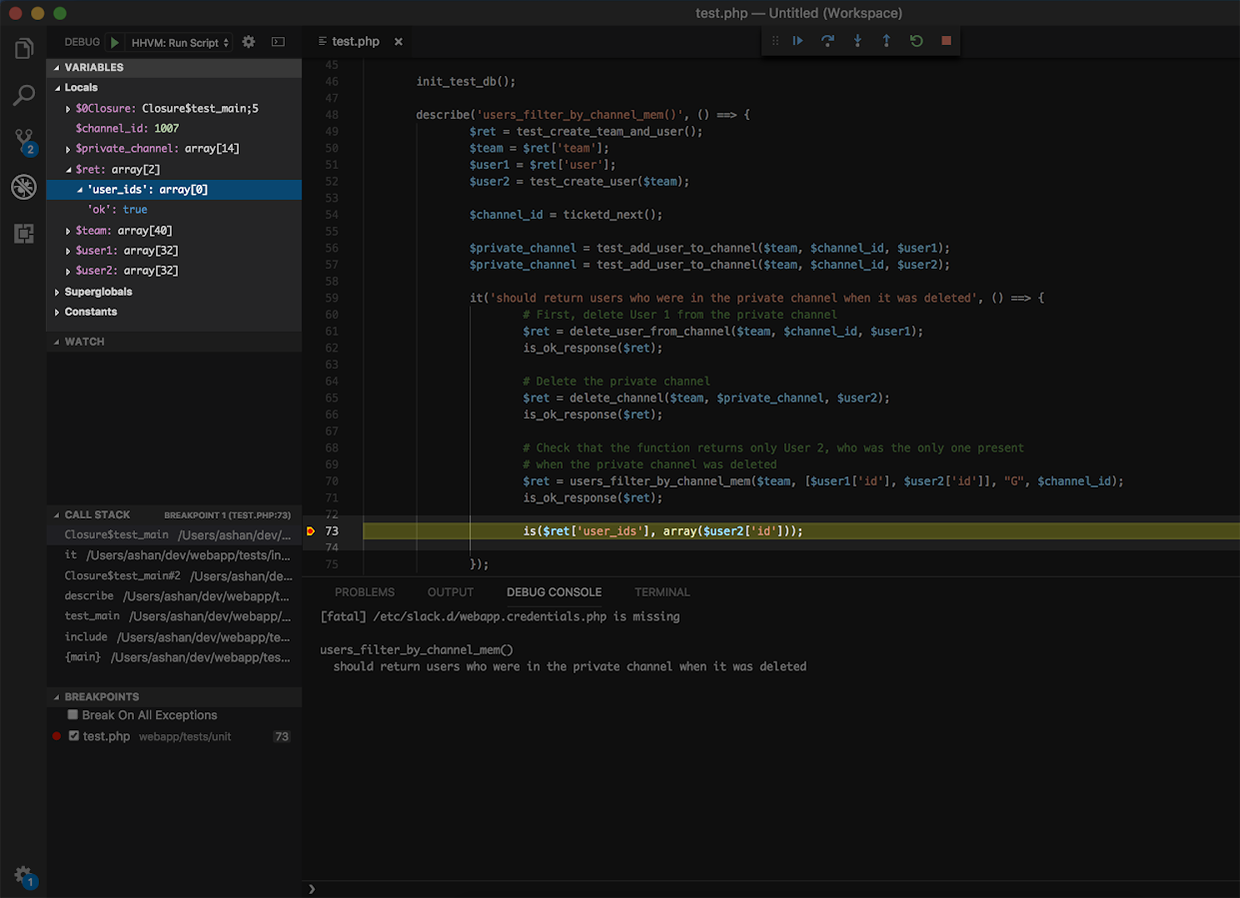
Most of the debugging you’ll need right away can be accomplished by inspecting the Variables menu. At any point in the execution of your debugger, you can view a dropdown of the variables in scope with their respective values.
Here, you can see that $ret[‘user_ids’] is empty, but the expected return should include the user_id corresponding to User 2. This is the most comprehensive ad hoc view of variables, but if you want to single out specific variables, the Watch or Debug Console REPL provide a more targeted approach to monitoring values.
Watch
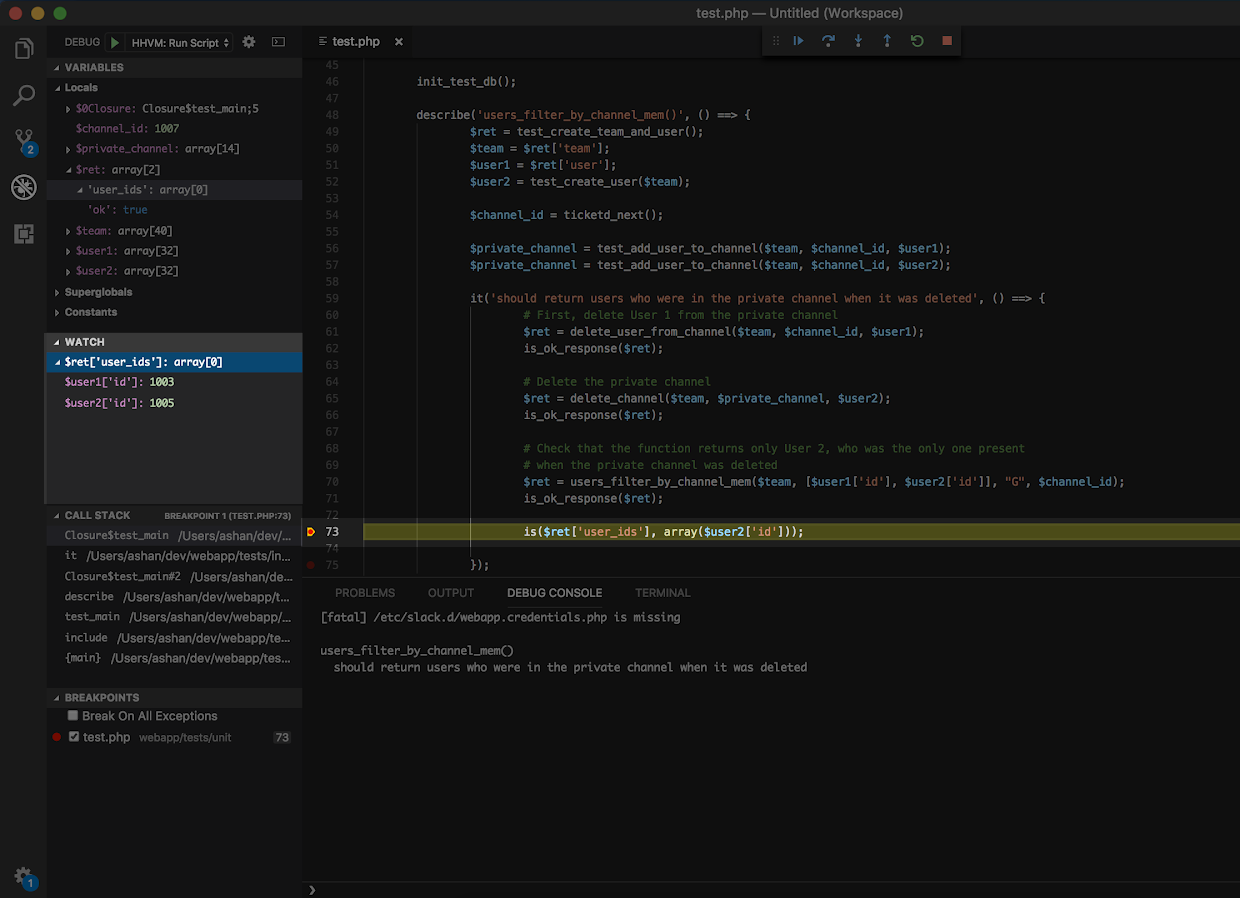
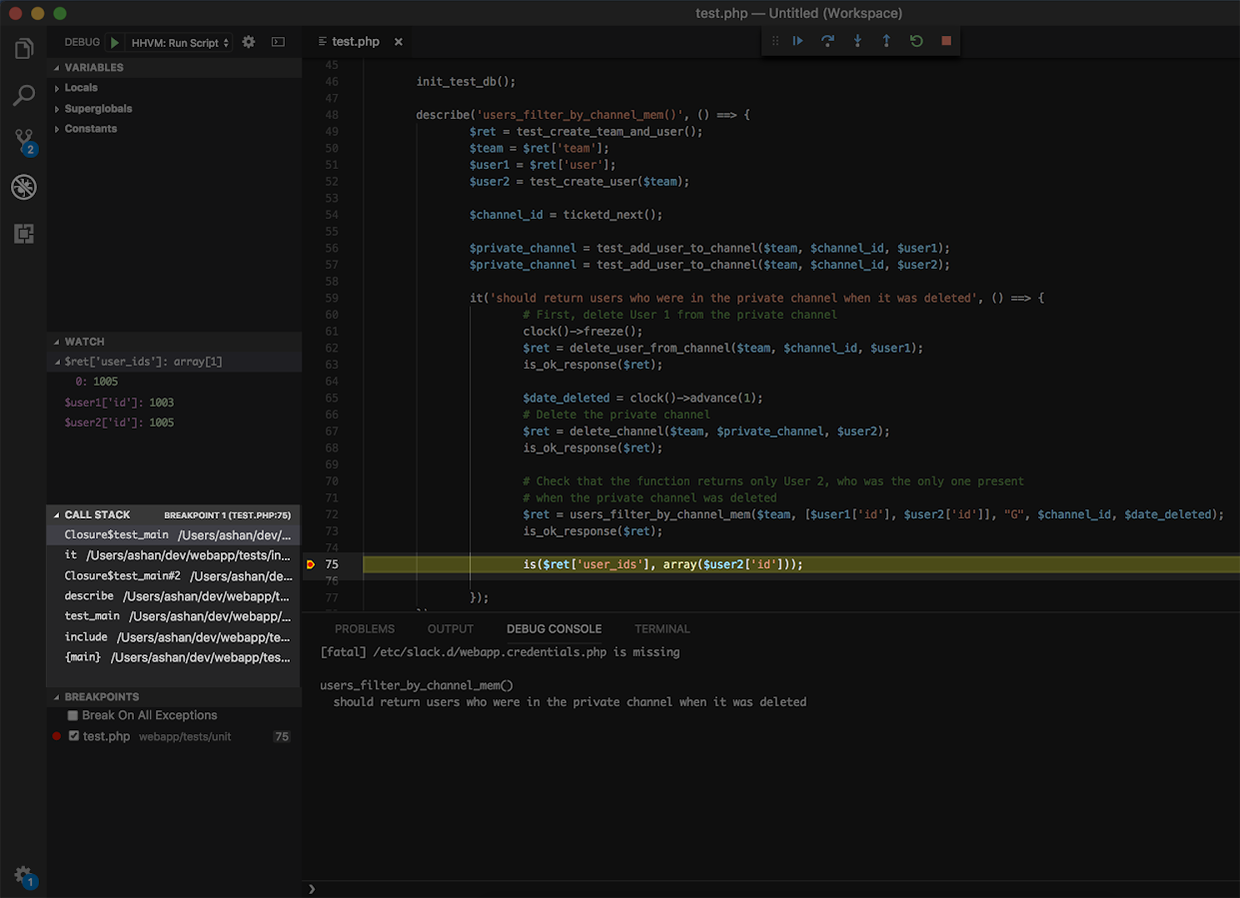
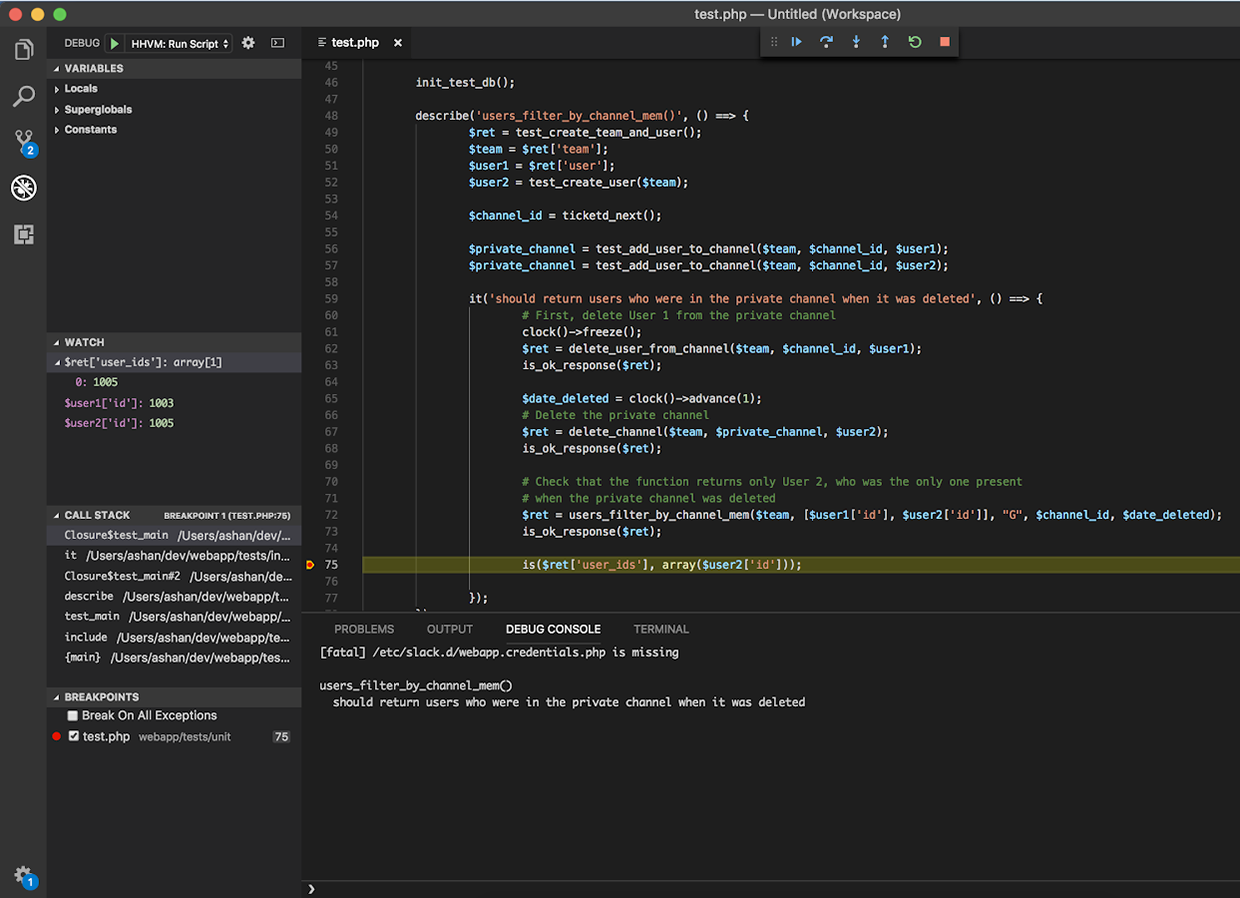
Right beneath the Variables menu is Watch, a space for you to define a list of variables or expressions and watch their values changes through multiple lines of execution. If you know your test is failing because there’s a mismatch in the expected and actual value of a variable, adding its expression to the Watch section lets you keep an eye on it through multiple runs of your unit test. That way, you’ll know exactly which line the variable receives an incorrect value.
In this case, we care about the discrepancy in $ret[‘user_ids’] so we want to keep track of the relevant user_ids and dig deeper to see why 1005 is not being returned despite User 2 being a member of the private channel when it was deleted.
Debug Console REPL
The Debug Console REPL provides an interactive way for you to evaluate expressions beyond what the Debug sidebar can offer. REPL stands for read-eval-print loop and is a simple interface that can take in single user inputs (an expression) and evaluate them. You can still see variable values by just typing in $variable_name, but you can also compose SQL queries to view the state of the database before and after a line of code.
Here, I ran a SQL query against the channels_members table that keeps track of the relationship between users and their channel memberships to see why both User 1 and User 2 were being returned by users_filter_by_channel_membership. As it turns out, both User 1 and User 2 have a timestamp value for their date_deleted attribute. users_filter_by_channel_membership only returns users currently present in the channel (or date_deleted = 0), which explains why User 2 is not being returned!
Call Stack
Lastly, we have the Call Stack, which shows the path your code takes all the way up to the line that’s currently executing. This tool is especially helpful when you’re navigating a large codebase and aren’t familiar with all the call sites for any given function. Use this stack as your guide as you follow the test’s execution, saving you from having to place print statements in all the possible call sites the function could have been called from. While it’s not being used in this example, it was immensely helpful in helping me pinpoint that users_filter_by_channel_membership was the culprit for why private channel deletion events weren’t being sent to the proper users.
So how did I fix the test?
This unit test was set up to mimic the way event dispatches occur in the existing implementation, where the user memberships are first deleted alongside the private channel before users_filter_by_channel_membership attempts to find everyone in the channel who should receive the dispatch. Because the SQL query constructed within users_filter_by_channel_membership did not consider the scenario in which we might be searching for already deleted users, I had to add an additional argument called $date_deleted that would allow me to specify a time range within which the user was deleted.
Setting Up Your Debugger
Getting all these tools to work together, especially if you’re working in an environment or language that isn’t popularly supported, can be tricky to get right. If you use Hack, you’re in luck! Slack uses synced cloud environments for local development, and the HHVM debugger for VSCode was originally developed to be compatible with this workflow. It also easily hooks up to local unit tests which don’t have external service dependencies.
To get started, install the Hack extension for VSCode. I’ve found that version 3.25 of HHVM or higher works best with this extension. Create or open the existing .vscode/launch.json file and include the following (with some tweaking to make the paths specific to your workspace) in your configuration:
{
  "version": "0.2.0",
  "configurations": [
    {
      "name": "HHVM: Attach to Server",
      "type": "hhvm",
      "request": "attach",
      "host": "localhost",
      "port": 8999,
      "remoteSiteRoot": <absolute path to site root on HHVM server>
      "localWorkspaceRoot": "${workspaceFolder}"
    },
    {
      "name": "HHVM: Run Script",
      "type": "hhvm",
      "request": "launch",
      "script": "${workspaceFolder}/tests ${file}",
      "hhvmArgs": [<extra args to pass in when launching script>]
    }
  ]
}
There are other options like Nuclide and Facebook’s command line debugger, but I found that the VSCode extension was the easiest to integrate into my existing workflow. Additionally, the HHVM debugger for VSCode has ongoing community support plus resources to help you get started.
Happy Debugging!
Whether you’re a new grad or a senior engineer, learning how to take full advantage of the information debuggers provide will bring clarity to failed tests and help you fix bugs more efficiently. If you want to put the skills you learned in this article to the test, come work with us!