

“Why is it slow?” is the hardest problem to debug in a complex distributed system like Slack. To diagnose a slow-loading channel with over a hundred thousand users, we’d need to look at client-side metrics, server-side metrics, and logs. It could be a client-side issue: a slow network connection or hardware. On the other hand, it could be a server-side issue: a request execution error or an edge case in code. Triaging and fixing these issues is a tedious process when we have to manually correlate all the logs and metrics for a single request across client devices, network devices, backend services, and databases.
Slack employs tools like Prometheus (metrics) and Elasticsearch/Presto (log querying) to provide visibility into these issues. And while metrics provide an aggregated view of the performance of a request, we don’t have granular information about why a specific request was slow. Our logs do contain the granular context needed to track how a specific request is processed, but they can’t provide additional context on what happened before or after that event.
Distributed tracing is a commonly used solution to stitch together requests across services. However, our prior experience with tracing uncovered two limitations that made us hesitant to adopt existing solutions. As documented in this post by Cindy Sridharan, using existing tracing tools and consuming traces via a trace UI may not justify the investment in building a solution. In addition, current tracing frameworks are primarily designed for backend services and we found them unsuitable for our client applications and shell scripts.
We also wanted to get more mileage out of our trace data by running ad hoc analysis using SQL queries in addition to viewing the spans in a trace UI. This insight mirrors Twitter’s experience with querying raw trace data for insights, as Dan Luu documented in this post.
To address these limitations and to easily enable querying raw trace data, we model our traces at Slack as Causal Graphs, which is a Directed Acyclic graph of a new data structure called a SpanEvent. This post is the first in a series where we talk about the motivations and architecture of our tracing system at Slack.
Tracing 101
To triage elevated error rates or performance regressions using logs and metrics, we have to mentally reconstruct a chain of events that happened as part of a request. This requires the relevant metrics and logs from a chain of different services. Once we have a representative request and its chain of events, the cause of the issue is usually obvious.
Distributed tracing automates the manual correlation described above, tracking a request across multiple services to create correlated logs. A typical distributed tracing setup involves the following components:
Instrumentation: An application is typically instrumented using an open source tracing library. It consists of 3 components: the sampler, the trace context propagation library, and the span reporter. A sampler samples the incoming request to see if the request should be picked for tracing. The trace context propagation library is responsible for tracking a request and propagating the trace context across threads (intra-process) in a process and also across various services (inter-process). The span reporter is responsible for collecting the produced spans and reporting them to a trace ingestion pipeline or a backend storage system.
Ingestion: The trace ingestion pipeline captures the spans emitted by the application, performs any additional sampling (tail-sampling) if needed, and writes the span data to a trace storage system.
Storage and Visualization: A trace storage component stores the traces for a set number of days, and allows searching and visualizing the trace data. The most common visualization layer for traces is a waterfall view.
Zipkin and Jaegar are two of the most popular open source tracing projects that follow the above model.
Why did we reinvent the wheel?
We found the traditional approach to distributed tracing didn’t suit us well. Starting with systems like Dapper, the distributed tracing community has traditionally modelled sequences of events spread across systems as distributed traces. Each segment in a trace is called a span. While the core idea of a trace as a sequence of causally related events (a causal graph) is not new, the core idea is often obscured by higher level APIs and internal span formats. The goal of our tracing system is to build and operate on a simplified form of a trace called a causal graph. In this section, we’ll discuss why we need to explicitly call out thinking in causal graphs as more fundamental than thinking in traces.
Tracing APIs are request centric.
Currently, tracing APIs like OpenTracing are designed to track a request —an operation with a clear start and an end — between backend services written in high-level multithreaded languages. In addition to the simple API to create Spans and report them to a tracing backend, the instrumentation libraries also track a request as it’s processed by various threads and thread pools inside an application.
While the current APIs work very well for their intended use cases, using those APIs in contexts where there is no clear start or end for an operation can be confusing or not possible. To trace mobile applications or JavaScript frameworks, whose event loops call into application code (inversion of control), we need complex workarounds in existing APIs that often break the abstractions provided by these libraries.
Current tracing APIs can be too restrictive or inflexible when a transaction context is not contained in the request context.
In theory, we can use traces to represent a dependency graph by a build tool like npm or Maven, a CI/CD flow in Jenkins, or a complex shell script execution. While these processes don’t follow the same execution model as a grpc application, large parts of their execution can be represented as traces and can benefit from trace analysis tools. Further, we also found that in those use cases there may be multiple request flows (producer-consumer patterns via kafka, goroutines, streaming systems) happening at the same time or we may want to track a single event across multiple request flows. In either case, having a single tracer for the execution of the entire application can be a limiting factor.
Current tracing APIs can be too heavy for simpler use cases.
For use cases where there is no clear notion of a request, a lightweight API is preferable. While a simpler API like the one below pushes the burden of intra/inter-process context propagation to the application developer, it’s easier to use and allows for a more gradual addition of tracing to a non-traditional application.
createAndReportSpan(traceId, spanId, parentSpanId, serviceName, operationName, startTimeMicros, durationMicros, tagsDict);Raw spans are internal implementation details in tracing systems. These spans aren’t meant to be produced or consumed by users directly.
Each tracing system has its own span format (Zipkin’s span thrift schema, Jaegar’s span thrift schema). Since they aren’t designed to be consumed by humans directly, they’re usually designed as internal formats and contain a lot of additional metadata in deeply nested structures. These internal implementation details are hidden from users, who interact with these spans via an instrumentation API at creation time and via the trace UI at consumption time.
If we were to produce spans directly from an application, we’d expose our developers to several confusing fields. For example:
- Both Zipkin and Jaeger spans have annotations/logs that declare zero-duration events that happened during the duration of a span. However, if these events had a duration attached to them, they’d be modeled as child spans.
- Jaegar spans don’t have a field for storing the service name. The service name for a span is defined in a process object.
- The trace_id on both Zipkin and Jaeger spans are represented as 2 64bit integers, a storage optimization.
- These spans are network centric. Zipkin has an endpoint as a field on both Annotations and BinaryAnnotations to capture the network information of the process. Jaegar spans are encapsulated in a Process struct.
Spans are not designed for raw consumption.
Traces capture very rich causal and contextual data. However, given the complexity of their span formats, these tracing systems don’t allow us to run complex analysis at interactive speeds on raw span data. For example, I’d like to be able to ask a question like “Am I missing my SLA because of slow DB queries on a specific http endpoint?” Even though traces contain this information, users often have to write complex Java programs, a multi-day effort, to answer their questions. Without an easy way to ask powerful analytical questions, users have to settle for the insights that can be gleaned from the trace view. This drastically limits the ability to utilize trace data for triage.
Our experience matches this article in that the constraints and limitations of tracing systems often don’t justify the effort of implementing tracing in an organization. Even when a tracing system is implemented, it falls by the wayside once the initial excitement wanes. Thus, it’s not surprising that tracing has seen anemic adoption in the industry when compared to technologies like containers, micro services, centralized logging, and service meshes.
Given the limitations of current tracing systems and our prior experience, we set the following goals to make our effort a success:
Goals
Our tracing system should be useful outside of our backend systems (ex: mobile, desktop clients, and async services).
Simple things should be easy. Hard things should be possible. Provide a simple, lightweight API for non-backend use cases. High-level APIs to capture complex request interactions within and across backend services written in multiple languages.
Traces should be useful for triaging incidents and performance regressions in real-time. We felt this would justify the return on investment in a tracing system.
Users of the system should be able to query raw span data and run analytics on spans belonging to different traces, or spans within a trace.
The tracing system should provide a visual query language for querying traces and an intuitive UI to visualize our traces and analytics.
Causal graph
The core idea of a trace is a directed acyclic graph of linked events called spans. However, this is often wrapped in a higher level tracing API and exposed via a trace UI. This hidden structure prevents us from meeting our goals of querying raw trace data and making traces suitable for a wide variety of use cases.
Like a trace, a causal graph is a directed acyclic graph of SpanEvents. A causal graph and a SpanEvent capture the essential aspects of a trace and a span, designed to meet the goals we defined in the previous section. A high-level overview of a causal graph is shown in the image below:
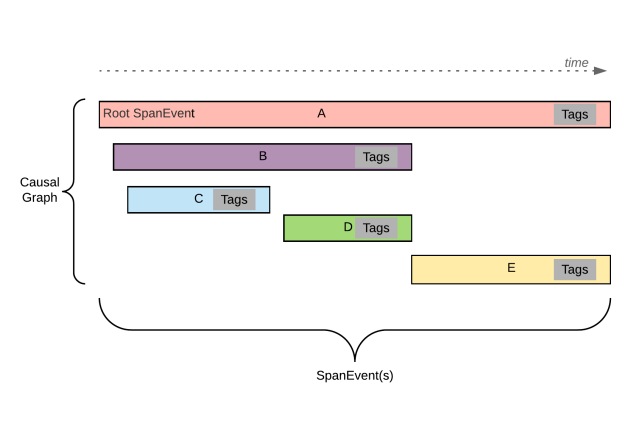
Figure 1: A sample causal graph is a graph of SpanEvents. In the above image, each horizontal rectangle represents a span event. The first SpanEvent in a causal graph that has no parent is referred to as the root. A SpanEvent can be a child of another SpanEvent. Each SpanEvent can optionally have Tags attached to it. A child SpanEvent can extend beyond the duration of the parent SpanEvent.
Facebook’s Canopy also defines a custom event format to represent spans and traces. We see the causal graph and SpanEvent as an evolution of that format which eliminates the need for the model reconstruction phase of their ingestion pipeline.
Causal graphs and SpanEvents
A Causal Graph is a graph of SpanEvent objects. A SpanEvent contains the following fields:
- Id – string – A unique id representing the event.
- Timestamp – long – Start time of operation.
- Duration – long – Time to perform an operation.
- Parent Id – string – An id of the parent event.
- Trace Id – string – An id for a trace (for deeply nested span events).
- Name – string – Name of the event
- Type – string – Type of event usually service name.
- Tags – Set<String, TypedValue> – Set of key value pairs.
- Span type – string – Type of span. (client, server, producer, consumer, annotation, etc..)
We think of SpanEvents as a lower-level object than a span in a distributed tracing system since we don’t place any restrictions on the data it contains. Data correctness is ensured by a higher-level tracing API or by user applications. As a result, a SpanEvent can represent any graph of related events. A SpanEvent is to tracing systems what an llvm IR is to a programming language. You can produce raw SpanEvents directly or use higher-level APIs to create them.
The SpanEvent format is designed for human consumption.
We embrace a flat structure and eschew deeply nested lists on the SpanEvent itself. Nested lists like annotations are represented as child spans with a specialized span-type tag. This makes filtering out the annotations very easy at query time if needed, without requiring complex SQL queries. While this makes annotations slightly less efficient over the wire, we felt that the ease of production and consumption justified the trade-off.
We also use a duration field instead of an end time on spans so we don’t have to subtract the start and end time fields when consuming them.
We allow spans with zero durations and empty IDs. A root span may or may not match the duration of the entire trace. We also encourage traces with only one span since they can be joined with other span events at query time. This also allows the gradual addition of more child spans to those events without any modification to the parent span. In addition, this ensures that queries we write on older data don’t need to be changed when child spans are added.
Every piece of metadata on the span is a tag.
Instead of optional fields on a span, we opt for tags with reserved keys for well known fields and typed values. This vastly simplifies both span creation and querying. Any information that’s useful for machine consumption, like references to other spans, is defined as a tag or specialized child span.
Generating a span event: SpanEvents can be generated in several ways. The simplest way is to generate a protobuf or JSON object from code and POST it to our backend using a simple function call like createAndReportSpan. The same thing can be achieved by invoking a curl command as shown below. This makes adding traces as easy as adding a log statement to our code or invoking an additional command in a shell script. Our mobile apps and shell scripts often use this approach.
curl -X POST -H "X-Slack-Ses-Id: 123455678" -d '[{                                                                    "id": "bW9ja19zcGFuX2lk",
 "parent_id": "bW9ja19wYXJlbnRfaWQ=",
 "trace_id": "bW9ja190cmFjZV9pZA==",
 "name": "pizza",
 "start_timestamp_micros": 1565045962061019,
 "duration_micros": 2000,
 "tags": [
   {"key":"topping","v_type":0,"v_str":"xtra_cheese"},
   {"key":"service_name","v_type":0,"v_str":"pizza_time"}
 ]
 }]' https://internal.slack.com/traces/v1/spans/json
For Hack and JavaScript applications, we’ve implemented OpenTracing compatible tracers, which generate spans in our SpanEvent format. For Go and Java applications, we use the amazing open source instrumentation libraries from Jaegar go and Zipkin brave respectively. We’ve written adapters to convert spans generated by these libraries into our SpanEvent format.
Querying Spans: We chose SQL as the query language for our span data because it’s widely used, flexible, easy to get started with, and supported by a wide variety of storage backends. Further, for users not comfortable with SQL there are several well known visual interfaces that can formulate SQL queries. While verbose, we found SQL to be well suited for expressing both simple and complex analyses of trace data very easily.
Architecture of our tracing system
The architecture of our tracing system is shown in the image below. It consists of the following components:
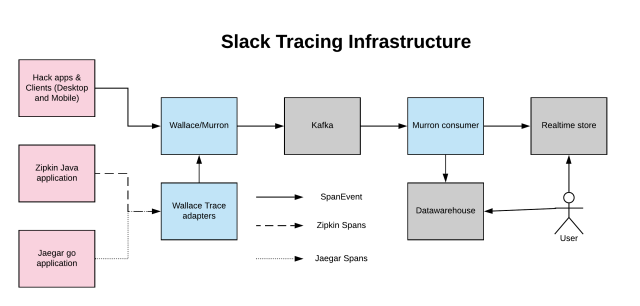
Our Hack applications are instrumented with an OpenTracing compatible tracer. Our mobile and desktop clients trace their code and emit SpanEvents using either a high-level tracer or a low-level span-creation API. These generated SpanEvents are sent to Wallace over HTTP as JSON or protobuf encoded events.
Wallace is an HTTP server application written in Go that runs independent of the rest of our infrastructure, so we can capture errors even when Slack is down. Wallace validates the span data it receives and forwards those events to Kafka, via Murron. Murron is our inhouse event bus that routes logs, events, and metrics from our applications to various storage backends in our infrastructure.
Our internal Java and Go applications use the open source instrumentation libraries from Zipkin and Jaegar respectively. To capture the spans from these applications, Wallace exposes reporting endpoints for both projects. These endpoints, called trace adapters, translate the reported spans into our SpanEvent format and write them to Wallace.
The trace data written to Kafka is processed using a lambda architecture. Murron Consumer is an internal Go application that reads our SpanEvents from Kafka and sends them to both a real-time store and our data warehouse.
The real-time store provides almost immediate access to our trace data with an end-to-end latency of less than 5 seconds. We use Honeycomb to visualize this data and run simple analytics, and it plays an important role in making our traces useful for triage.
By comparison, our data warehouse lags by 2 hours. Here we use Presto, which supports complex analytical queries over longer time ranges via SQL. Our engineers use this to better understand long-term trends and to answer questions they can’t easily solve with Honeycomb.
Production deployment
Currently, our tracing pipeline traces a request end to end across our stack, from our clients to our backend services and on to our storage layer. We also have several novel applications of traces like tracking websocket states in our clients and monitoring our Jenkins CI/CD pipeline executions. We’ve even traced our build dependency graphs to understand where our builds are slow.
Like other services at Slack, the adoption of tracing has followed the sigmoid curve. Our tracing pipeline has been in production for over a year now and we trace 1% of all requests from our clients. For some low volume services, we trace 100%. Our current pipeline processes ~310M traces/day and about ~8.5B spans per day, producing around 2Tb of trace data every day.
The ability to query raw traces has unlocked some very powerful insights into our services and customer experience at Slack. Traces have become one of the primary ways to triage and fix performance issues at Slack. We have also made use of trace data to successfully triage production incidents and to estimate the end-user impact of a deployment or incident.
With tracing data we can also answer very complex questions about our application that weren’t possible before like:
- What is the effect of a given improvement on user-perceived latencies and errors?
- Is a particular client request slowdown because of a backend delay?
- Are cross-region queries increasing user perceived latency? By how much?
- What is a representative trace for a given endpoint?
- What are the hotkeys for memcache? What endpoints are generating those hot keys?
- What async tasks are run for a given request? How long did those tasks take?
The causal graph model and the SpanEvent format have allowed us to represent each span as a single row in a table. This simplicity has made querying trace data easy and the value proposition of tracing straightforward. As a result, tracing has seen rapid adoption across the organization. By comparison, Twitter’s trace data was split into six tables which, while probably more efficient, would make querying much harder.
To conduct targeted investigations for specific customer issues reported to our CE team, the desktop client team added a special slash command to our client, which traces every request on the client for the next two minutes. Once this command is run, we trace all requests from the client without sampling them.
Our client team has also started using SpanEvents as a generic event format to report client logs to the backend. Reusing the SpanEvent format has helped us leverage the same real-time ingestion pipeline for traces as well as logs. Using similar field names between the two has also made querying more intuitive.
After running the system in production for a year, we can confidently say that we’ve met all the goals we set out to achieve with our tracing pipeline.
What’s Next?
In the future, we plan to build on this success by adding a more powerful query language for querying trace data.
For large services, we currently sample 1-2% of requests. We’d like to provide a way to sample all the requests for a cohort of users (a specific team, device or version) over longer periods of time. We’d also like to explore adaptive sampling strategies for sampling spans in a request at different rates.
Today our traces, logs, and events are islands with a lot of duplication among them. Going forward, we aspire to consolidate this infrastructure into a more unified system based on tracing.
Conclusion
In this post, we’ve described the architecture of our tracing system. It’s designed around a new structure called a SpanEvent which is designed to be both easy to produce and simple to query without sacrificing the core idea of a span.
Our tracing system has been deployed in production for over a year now and produces ~330M traces and ~8.5B spans per day. Our users find it very easy to produce and consume span data. As a result, we’re able to represent a broad range of application interactions as causal graphs: complex backend microservice interactions, mobile, and desktop client interactions and CI/CD flows in Jenkins jobs to name a few.
Using SQL as our query language has given both novice and advanced users the ability to query our tracing data and get the insights they need. As a result, we’ve identified and fixed many performance and reliability problems in our product. Tracing has become one of the primary tools for debugging and fixing performance and reliability issues at Slack.
In the next post of this series, we’ll cover various use cases of tracing at Slack in greater depth.