Notifications are a key aspect of the Slack user experience. Users rely on timely notifications of mentions and DMs to keep on top of important information. Poor notification completeness erodes the trust of all Slack users.
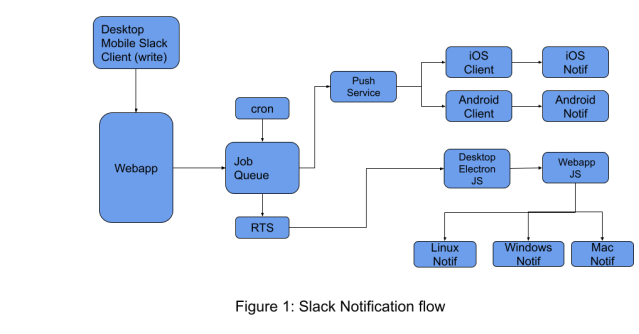
Notifications flow through almost all the systems in our infrastructure. As illustrated in Figure 1 below, a notification request flows through the webapp (our application logic and web / Desktop client monorepo), job queue, push service, and several third-party services before hitting our iOS, Android, Desktop, or web clients.

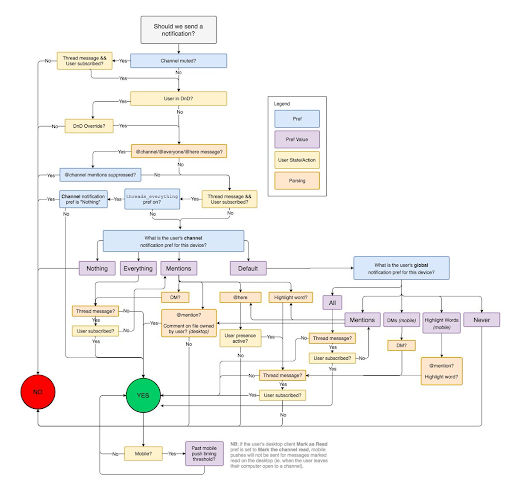
Further, the decision about when and where to send a notification is also very complicated, as shown in Figure 2 below, which is from our 2017 blog post (also summarized here).

Since 2017, our notification workflow has only grown more complex, through the addition of new features like Huddles and Canvas. As a result, solving notification issues can lead to multi-day debugging sessions across several teams. Customer tickets related to notifications also had the lowest NPS scores and took the longest time to resolve compared to other customer issues.
Debugging notification issues within our systems was difficult because each system had a different logging pipeline and data format, making it necessary to look at data with different formats and backends. This process required deep technical expertise and took several days to complete. The context in which events were logged also varied across systems, prolonging any investigations. This resulted in a time-consuming process requiring expertise in all parts of the stack just to understand what happened.
We began a project to trace the flow of notifications across our systems to address these challenges. The goal was to standardize the data format and semantics of events to make it easier to understand and debug notification data. We wanted to answer questions about notifications such as: if it was sent, where it was sent, if it was viewed, and if the user had opened it. This post documents our multi-quarter, cross-organizational journey of tracing notifications throughout Slack’s backend systems, and how we use this trace data to improve the Slack customer experience for everyone.
Notification flow
The sequence of steps to understand how notifications were sent and received is something we’ve dubbed the “notification flow.” The first step to improve the notification flow was to model the steps in the notification process the same way across all our clients. We also aimed to capture all events in a common data model consistently in the same format.
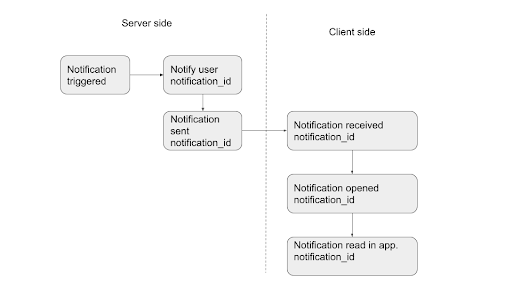
We created a notification spec to understand all the events in a notification trace. This involved identifying all the events in a trace, creating an idealized funnel, and setting the context in which each event will be logged. We also had to agree on the semantics of a span and the names of the events, which was a challenging task across different platforms. The result is a notification flow (simplified for this blog post), shown in the image below.

Mapping notification flow to a trace
After we finished planning the flow of our system, we needed to pick a way to keep track of that information. We chose to use SlackTrace because a trace was a natural way to represent a flow, and all the parts of our system can already send information in the span event format. However, we encountered two major challenges when modeling notification flows as traces.
- 100% sampling for notification flows: Unlike backend requests—which were sampled at 1%—notification flows shouldn’t be sampled since our CE team wanted 100% fidelity to answer all customer requests. In some scenarios like `@here` and `@channel`, a push notification message would be potentially sent to hundreds of thousands of users across multiple devices, resulting in billions of spans for a single trace of a slack message. A trace with potentially billions of spans would wreak havoc on our trace ingestion pipeline and storage backends. No sampling would also force us to trace every Slack message sent.
- Tracing notifications as a flow separate from the original message sent trace. Currently, OpenTelemetry (OpenTracing) instrumentation tightly couples tracing to a request context. In a notification flow, this tight coupling would break since the notification flow executes in multiple contexts and doesn’t cleanly map to a single request context. Further, mixing multiple trace contexts also made implementing tracing across our code challenging.
To solve both of these challenges we decided to model each notification sent as its own trace. To tie the sender’s trace to each of the notifications sent, we used span links to causally link the spans together. Each notification was assigned a notification_id which was used as a trace_id for the notification flow.
This approach has several advantages:
- Since SlackTrace’s instrumentation doesn’t tightly couple trace context propagation with request context propagation, modeling these flows drastically simplifies the trace instrumentation.
- Since each notification sent was its own trace, it made the traces smaller and easier to store and query.
- It allowed 100% sampling for notification traces, while keeping the senders sampling rate at 1%.
- Span linking helped us preserve causality for the trace data.
Different teams worked together to map the steps in the notification flow to a span. The result is a table as shown below.
| Span name | Description | Trace id | Parent span id | Span tags |
| notification:trigger | Determine if the notification should be sent or not. | Trace_id is the request id. Span links have a list of notification_id’s sent. | trigger_type (DM, @here, @channel), user_id, team_id channel_id message_ts notification_id | |
| notification:notify | Notify the user on all of their clients. | Trace_id is notification_id. | Id of notification:trigger span. | user_id, team_id channel_id message_ts |
| notification:sent | Notification is sent to a slack client to all the multiple slack clients on the user’s device. | Trace_id is notification_id | ID of notification:notify | channel_id platform specific notification tags. |
| notification:received | Notification is received on the user’s slack client. | Trace_id is notification_id | ID of notification:sent span. | Service name is client name and client tags. |
| notification:opened | User opened a notification on the device. | Trace_id is notification_id | ID of notification:received span. | Service name is client name and client tags. |
| notification:read in app | User clicked on the notification to view the notification in the app.The start of the span is right after opening. The end of the span is when the message is rendered in the channel. | Trace_id is notification_id | ID of notification:opened span. | Service name is client name and client tags. |
Advantages of modeling a notification flow as a trace
Representing the notification flow as a Trace/SpanEvent has the following advantages over our existing methods.
- Consistent data format: Since all the services reported the data as a Span, the data from various backend and client systems was in the same format.
- Service name to identify source: We set the service name field to Desktop, iOS, or Android to uniquely identify the client or service that generated an event.
- Standard names for contexts: We used the span name and service name to uniquely identify an event across systems. For example, the service name for a notification :received event would be iOS, Android and Web to accurately tag these events. Previously, the events from these three clients would have different formats and it was hard to uniformly query them.
- Standardized timestamps and duration fields: All the events have a consistent timestamp in the same resolution and time zone as the rest of the events. If there is a duration associated with an event, we set the duration field or set it to a default value of 1 when reporting a one-off event. This provided a single place for storing all of our duration information.
- Built-in sessions: We would use the notification ID as the trace ID for the entire flow. As a result all the events in a flow are already sessionized and there is no need to further sessionize the data. For example, we couldn’t use the notification ID as the join key everywhere since only some events would have a notification ID. For example, the notification triggered of a notification read event wouldn’t have a notification ID in them. We can use the trace ID to tie these events together instead of using bespoke events.
- Clean, simple, and reliable instrumentation: Since a trace is sessionized, we only need to add the tags to the trace once when we model the notification flow as a trace. This also made the instrumentation code cleaner, simpler, and reliable since the changes were localized to small parts of the code that can be unit tested well. It also made the data easier to use since there is only one join key instead of bespoke join key for some subset of events.
- Flexible data model: This model is also flexible and extendable. If a client needs to add additional context, they can add additional tags to an existing span. If none of the existing spans are a good fit, they can add a new span to the trace, without altering the existing trace data or trace queries.
- No duplicate events: The SpanID in the event helped capture the uniqueness of events at source. This reduced the number of events that were double reported and removed the need to de-dupe events in our backend again. The older method reported thrift objects without unique IDs which led to using de-dupe jobs to identify double reporting of events.
- Span linking for tying related traces together: Linking spans across traces helps preserve causality without resorting to ad hoc data modeling.
How we use notification trace data at Slack
After several quarters of hard work by several teams we were able to trace notifications end-to-end across all the Slack clients. Our traces were sent to a real-time store and our data warehouse using the trace ingestion pipeline.
Developers use the notification trace data to triage issues. Previously, tracking notification failures involved going through logs of several systems to understand where a notification was dropped. This process was involved and took several hours of very senior engineers’ time to understand what went on. However, after notification tracing, anyone was able to look at a trace of the notification to precisely see where a trace was sent and where in the flow a notification was dropped.
Our customer experience team uses trace data to triage customer issues much faster these days. We now know precisely where in the notification flow a message dropped. Since our traces are easier to read, our CE engineers can look at a trace to learn what happened in a notification to answer a customer’s query instead of escalating it to the development team, who then had to comb through the varied logs. This helped us triage our notifications much more quickly, and reduced the time to triage notification tickets for our CE team by 30%.
Notification analytics
Currently, we ingest notification trace data to ElasticSearch/Grafana and our data warehouse.
Our iOS engineers and Android engineers have started using this data to build Grafana dashboards and alerts to understand the performance of our clients. Typically, client engineers don’t use dashboarding tools like Grafana, but our client engineers have used them very effectively to triage and debug issues in our notification flow.
We have also ingested this data into our data warehouse, over which anyone can run complex analytics on this data. Initially data scientists used this data to understand performance regressions in our clients over long periods of time.
The span event format and tracing system also has an unexpected benefit. Our data scientists used this data to build a product analytics dashboard showing funnel analytics on notification flows, to better understand notification open rates. Typically, that product analytics data would be captured by a separate set of instrumentation ingested via a different pipeline into the data warehouse. However, since we sent the trace data to the data warehouse, our data scientists can use it to compute funnel analytics on the data to get the same insights.
An even more extraordinary outcome was when the data scientists were able to mine the trace data to identify and report bugs in application and instrumentation. In the past two years since, notification traces were used many times outside of the initial use case. This shows the advantages of using trace data as a single source of truth, due to its support for multiple use cases.
Conclusion
Modeling flows or funnels as a trace is a great idea, but there are some challenges. In this blog post we have shown how Slack modeled notification flows as traces, the challenges we faced, and how to overcome those challenges through careful modeling.
Implementing notification tracing wouldn’t have been possible without decoupling the trace context propagation from a request context in the SlackTrace framework. The instrumentation helped us quickly and cleanly implement tracing across several backend services, while avoiding the negative side effects of existing libraries, such as cluttered instrumentation and large traces. Currently, we instrument several other flows in the production Slack app using the same strategy.
Modeling notification flows as trace data helped our CE team resolve notification issues 30% faster while also reducing escalations to the development team.
In addition to the original use case of debugging notification issues, notification trace data was also used for calculating funnel analytics for production analytics use cases. Modeling product analytics data as traces provides high-quality data in a consistent data format across all of our complex stack. Further, the built-in sessionization of trace data simplified our analytics pipeline by eliminating additional jobs to de-dupe and sessionize the trace data. In the past two years, backend and frontend developers and data scientists have used the trace data as a single source of truth for multiple use cases.
The success of notification tracing has encouraged several other use cases where flows are modeled as traces at Slack. Today in the Slack app there are at least a dozen tracers running simultaneously in the Slack app.
Interested in taking on interesting projects, making people’s work lives easier, or optimizing some code? We’re hiring! 💼
Apply now


