

A customer writes in and says the dreaded words: “My app is slow”. Here we go…
Performance problems can be a real struggle to track down, especially if they aren’t easily reproducible. Looking at the customer’s logs, you see that it takes over 1.5 seconds to switch between channels on their Android client! That must be what they’re talking about, but what’s causing the slowdown? Nothing else pops out to you in the logs and the trail’s gone cold.
Slack client engineers were running into situations like this too frequently, where they knew a performance issue existed but couldn’t find the underlying cause. We were tired of letting our users down by not being able to diagnose their issues. Our mobile and desktop client infrastructure team did a survey of available technologies and, you guessed it, tracing was the perfect tool for the job!
Distributed tracing is a widely-used technology for understanding latency in a multi-service web application, but we found it opens up a new world of possibilities for understanding performance on the client as well. In this post we’re going to explain how we shipped our tracing stack to our iOS, Android, and JavaScript clients, and what we learned along the way.
Part I: Infrastructure
A quick tracing primer
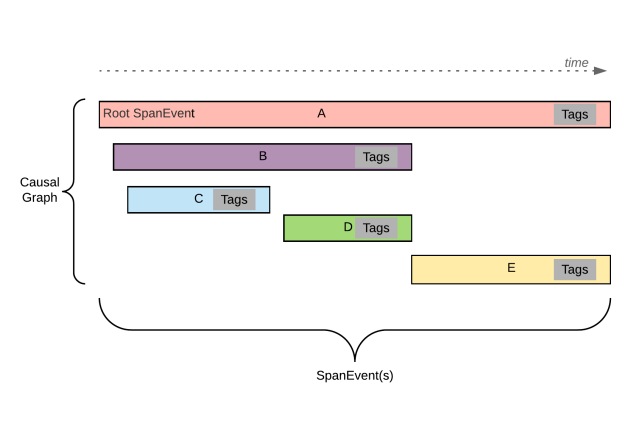
Distributed tracing is a common technology for managing distributed services, but it’s still quite new for client instrumentation. Tracing allows you to instrument how long an action takes (called a <span style="font-weight: 400;">span</span>) and break it down into smaller sub-actions (called <span style="font-weight: 400;">child spans</span>). This allows you to not only tell when something gets slower, but also pinpoint where and why it got slower. The “distributed” in distributed tracing comes from its ability to combine spans from separate services, on separate machines, into a single trace. This gives you a single picture describing latency in a multi-service architecture.
Every span in the trace can be thought of as a structured log. They all have the same <span style="font-weight: 400;">trace_id</span>, which allows our tooling to group them together. (This will come in handy later)
For more information on what tracing is and our infrastructure that supports it, see our previous blog post, Tracing at Slack
Understanding client / server latency
Tracing at Slack outlines how we implemented tracing across our API layer. With that in place, we could look at any endpoint to see how long our backend spent servicing requests and which services were slowing us down. There was only one problem — while our backend might think a request took 80ms to service, the network delay meant that our clients were seeing something totally different! At the end of the day user perception is what we really care about, which meant it was time to take request tracing to the client.
A reasonable start was to trace how long it takes to run the request from the client’s perspective. We called the span <span style="font-weight: 400;">api:request</span> . That gave us something that looked like this:
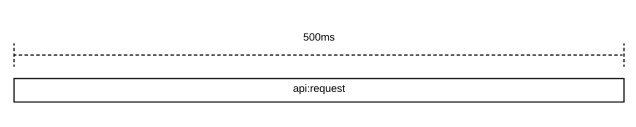
Perfect, now we understand how long it takes to make an API call on the client. This isn’t the full picture though. We’ve been fixing performance issues for a long time and we know that there are various things that can go wrong:
- Clients can only make a limited number of concurrent requests. If you’re making a lot of API calls, you need to put them in a queue. Our desktop app has priority queueing for requests, but our mobile clients don’t. Does that make a big difference?
- We use strongly typed API responses on mobile. Inefficient parsers can take a long time, especially on older devices. Are there inefficient API calls that we don’t even know about?
- We attempt to retry API calls internally. How often does that happen? Does it behave as expected?
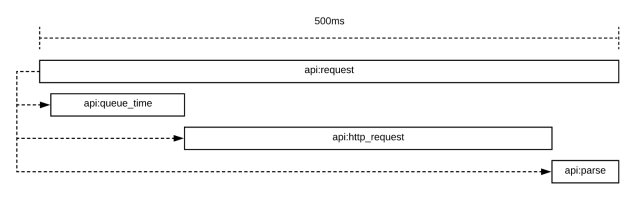
Since this is tracing, we’re able to consider all of these things together instead of as separate metrics reported from the client. We decided to break <span style="font-weight: 400;">api:request</span> down into three phases:
<span style="font-weight: 400;">api:queue_time</span>: The time we spend sitting in an API queue before executing our request<span style="font-weight: 400;">api:http_request</span>: The time it takes to make a single HTTP request and get a raw response payload back from the server<span style="font-weight: 400;">api:parse</span>: The time it takes to parse the data in the response into an object we return to the caller. This could be a dictionary, a strongly typed object, or whatever makes sense for the platform.
When each phase is complete, we also include metadata like what endpoint the log was for, HTTP status code, or how many bytes were returned from the HTTP request.
Clearly distinguishing between the client-side processing and network latency makes it clear to developers if their API call is slow due to the system being overloaded, or slow due to API response parsing (Hello Java reflection, my old friend). There’s one thing missing — was my HTTP request slow because of network issues, or did our backend take a long time to service the request?
Because distributed tracing was built for measuring latency across systems, the solution was simple. All we had to do was plumb the trace identifiers we described earlier through our HTTP request header so that we could have client and server logs together in the same trace.
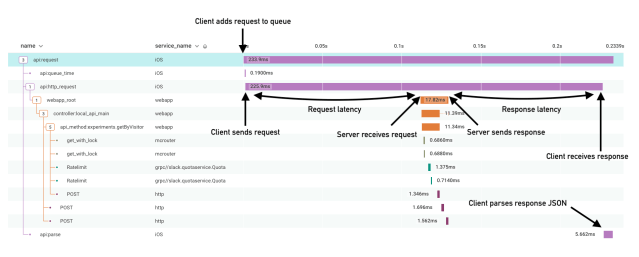
And it worked! In a single chart we’re able to see:
- What the impact of a busy system is on our API layer
- Which endpoints are the slowest to parse on the client
- How our network latency impacts request latency
Above is an example trace from one of our production clients. This screenshot and others throughout the post come from a product called Honeycomb, which we use to interact with traces.
Production roll out
We decided to match our existing backend sampling strategy and roll this out to 1% of all API requests, across all clients. That proved to be enough to give us a clear signal and also guarantee that when teams working on new features add a new API call, we have their back.
Understanding database performance
While network speed and API performance are often regarded as the biggest bottleneck on the client, modern applications have become much more complex than simple request/response web pages. Our customers expect our apps to cache information they’ve already seen and to support seamless interactions even when they’re offline. To accomplish this we’ve built our mobile apps on top of fully-featured SQLite databases, which play a large role in overall application performance. Understanding database performance in the wild was notoriously difficult with previous tools, and we knew we could do it better with tracing.
Modeling database access
When working with a database, most systems follow a similar flow:
- Begin a transaction. If the database is already being used this may require us to wait until the previous transactions are completed.
- Create, read, update, and delete records.
- Close the transaction, atomically committing all changes to the database.
Our iOS application implements this pattern like so: The provided block is executed once a database transaction has been opened, and when the block returns all changes made during the transaction are committed to the database. If an exception is thrown, the transaction will be rolled back and no changes will be committed.
// Opens a write transaction and updates the user for the given id
 db.performWriteTransaction {
    $0.write(
        DBUserChangeSet(id: id, properties: [
            .firstName("Ted"),
            .lastName("Mosby"),
            .occupation("Architect")
        ])
    )
 }
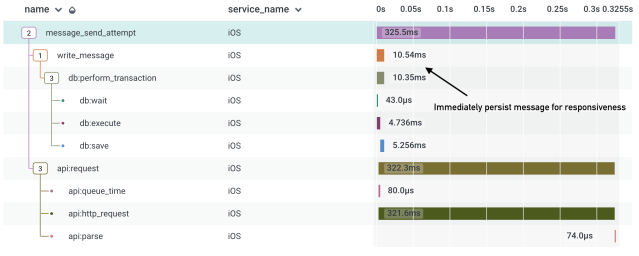
The question is, what information about the transaction should we include in the trace? We ended up taking a lot of inspiration from how we structured <span style="font-weight: 400;">api:request</span>
<span style="font-weight: 400;">db:wait</span>: We are limited on the number of concurrent database transactions, so when the system is under load we can expect to wait a while until the transaction is opened.<span style="font-weight: 400;">db:execute</span>: The time it takes to execute the transaction will tell us how long it takes to read & write from the DB. Oftentimes this is when business logic that has nothing to do with accessing the database can sneak in and back up our DB queue.<span style="font-weight: 400;">db:save</span>: The time it takes to save the dirty changes to disk reflects how many changes were created during the transaction.<span style="font-weight: 400;">db:perform_transaction</span>: The total amount of time it takes to wait, execute, and save the transaction.
When we put it all together, it comes out looking something like this:
![]()
Client Tracing API
So what does the code look like? When figuring out how to implement tracing we considered a couple of options. OpenTracing is a widely-used standard and has a general-purpose API for creating traces in code. While it’s a great option, with our simplified span event format we saw an opportunity to make a more opinionated API, designed to work specifically for the needs of clients. For example, a common pattern used in OpenTracing is leveraging thread local storage to hold context about the current trace to easily append child spans. This breaks on mobile clients where concurrency is the default, and a given operation will inevitably pass through many different threads.
By writing our own API, we were also able to take full advantage of the language features available on each platform. While the details of the API vary between languages, the interfaces are roughly the same. We’ll be showing our <span style="font-weight: 400;">Swift</span> code in this post.
Tracer & Spannable
To begin a trace, we use an object called a <span style="font-weight: 400;">Tracer</span>. This creates a new trace and marks the time at which the trace was started. The return type adheres to a protocol we call <span style="font-weight: 400;">Spannable</span> . <span style="font-weight: 400;">Spannable</span> is quite simple — it defines an object that can be started, completed, or cancelled. To maximize the surface area that we trace without overloading our backend with logs, we use sampling to limit how many logs are uploaded by clients. Sampling is done in the <span style="font-weight: 400;">Tracer</span>, and the resulting object is <span style="font-weight: 400;">nil</span> if we aren’t going to perform the trace. Once the action being measured is complete, we simply call <span style="font-weight: 400;">complete()</span> on the trace with any metadata we’d like to upload along with it.
One of the challenges we faced on mobile was that at any time, the application could be sent to the background, which means that the process will be put to sleep (and eventually killed). We aren’t informed by the operating system when this happens, which leads to crazy outliers. To fix this issue, internal to our tracing system we simply complete all open traces when the system informs us the app is sent background and mark them with a <span style="font-weight: 400;">_background_flush : true </span>to indicate to our tooling that the trace was incomplete.
Creating child spans
Every <span style="font-weight: 400;">Spannable</span> instance has something called a <span style="font-weight: 400;">TraceContext</span>. <span style="font-weight: 400;">TraceContext</span> lets us insert child spans into our trace. The benefit of having this be in a separate object is that it lets us limit the behavior possible in the function. APIs that take <span style="font-weight: 400;">TraceContext</span> are able to add subspans to the trace, but they cannot complete the span without us knowing. Furthermore, by injecting the context explicitly instead of implicitly reading it from thread local storage, we can safely pass it across thread boundaries.
Integrating into our infrastructure
The less work application developers have to do to get helpful trace information, the better. To make it easy we added <span style="font-weight: 400;">TraceContext</span> support to our most commonly used infrastructure libraries like networking and persistence.
Example
Here is a real code snippet from our iOS codebase for a trace that measures how long it takes to update which channels in a workspace are unread and contain mentions. It’s a simple example that makes an API call and inserts the results into our database, and it leverages all of the concepts outlined above.
// Start a new trace, called "update_conversation_read_state"
let trace = Tracer.shared.startTrace(name: .updateConversationReadState)

// Create our API request, and attach our trace context to it
let request = ClientCountsRequest()
request.properties.traceContext = trace?.context

firstly {
    // Run an HTTP request, passing our trace context
    httpManager.run(request)
}.then { response in
    // Update our cache, passing our trace context
    return db.performTransaction(trace?.context) {
        let changes = response.channels.map { channel in
            DBConversationChangeSet(
                id: channel.id,
                properties: [
                    .hasUnreads(channel.hasUnreads),
                    .mentionCount(channel.mentionCount),
                ]
            )
        }

        $0.write(changes)
    }
}.done { _ in
    // If successful, complete the trace with success:true
    trace?.complete(["success": true])
}.catch { error in
    // If successful, complete the trace with success:false
    trace?.complete(["success": false, "error": error])
}
Part II: Real world applications
Modeling user interactions
API latency and database performance are critical building blocks for understanding the low-level performance of any app. What these metrics lack, however, is context on how operations impact user experience. First and foremost we invest in performance to make the product better for our users, so it’s time to tie everything together by modeling user interactions with tracing.
View load times
The most common interaction in any user facing app is loading views, and it should be fast. Being a messaging app, we decided to start with our most important screen — the channel view. We’ve been optimizing the performance of opening a channel for a long time, and we make heavy use of our database to do so. Our goal is to always show the user whatever we have in our cache as quickly as possible, and asynchronously fetch the latest content from the server. We’ve spoken about this approach previously in our unified cross-platform performance metrics post. With tracing, we can do better. The flow looks something like this:
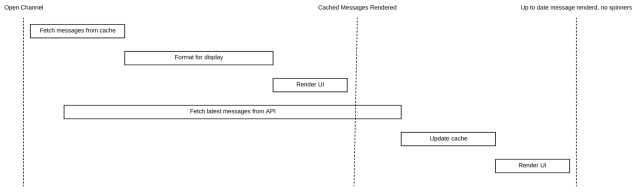
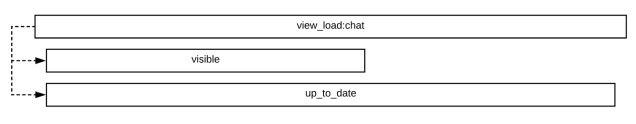
As it turns out, this pattern of “render what’s in the cache while we fetch the latest from the server” is generally applicable to most of the screens in the app. We decided to make a general-purpose schema for tracing views that we call a <span style="font-weight: 400;">View Load Trace</span>. View load traces are simple and require three different spans:
- view_load:<feature_name>: The root of the trace. This is completed when both
<span style="font-weight: 400;">visible</span>and<span style="font-weight: 400;">up_to_date</span>are completed. Examples include<span style="font-weight: 400;">view_load:chat</span>(our internal name for the channel view),<span style="font-weight: 400;">view_load:all_threads</span>, etc. - visible: Time until meaningful content is rendered in the view. “Meaningful” is the important word to focus on here and changes from screen to screen. For
<span style="font-weight: 400;">view_load:chat</span>we decided to consider<span style="font-weight: 400;">visible</span>complete once we can see messages on the screen. Any spans related to querying our local cache or rendering the UI should go here. - up_to_date: Time until view has up-to-date content. Any spans related to fetching information from the server should go here.
With this schema in place we created a new kind of tracer (<span style="font-weight: 400;">ViewLoadTracer</span>) to implement the spec, and used it to measure the performance of many different screens in the app. By injecting the <span style="font-weight: 400;">TraceContext</span> into our existing services (persistence, networking, etc.) these traces proved to be incredibly useful for identifying bottlenecks in these complex systems where we’re fetching data from multiple places and rendering it on the screen.
Measuring actions
The next kind of interaction we wanted to measure was actions taken inside of Slack, like sending a message or adding an emoji reaction. From a tracing perspective, it proved to be pretty easy! For message sending, we started the trace when the user hit “Send” and completed the trace once we finished making the API call that posts the message. By leveraging database and API tracing, we were able to get a full picture of the interaction:
We suffix all of these types of traces with <span style="font-weight: 400;">_attempt</span> because we recognized this as a great opportunity to understand the reliability of the action — how often does message sending succeed or fail? By adding a <span style="font-weight: 400;">success</span> tag to every trace we can create client-side metrics about reliability, which prove to be a useful tool for assessing the impact of production incidents on our clients. Most incident metrics observe API failure rate, but what’s missing from them is the visible impact on the user. An API may be failing 50% of the time, but with proper retry logic on the client the user may never notice. Tracking reliability as the user sees it gives us a much more complete picture of how the product is behaving for our customers.
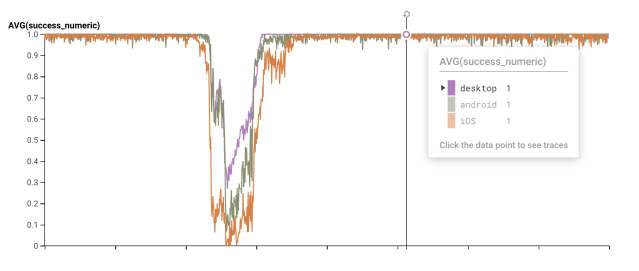
Below you can see an example from an incident simulation exercise that helped us understand its impact on message send reliability. The chart shows three lines —- one for each client — where the value of the series is the success rate for the <span style="font-weight: 400;">message_send_attempt</span> trace. The main thing to observe here is that we can see precisely when the outage began impacting clients, how long they were impacted for, and the shape of the recovery. Incident response at Slack relies on accurate timelines for assessing what happened, when mitigation is working, and when we can consider the incident complete. Accurate client logs are often the best way to tell that story.
Tracing user interactions also gives us a much more complete picture of how our applications handle themselves in the case of an incident. What do our clients do when our servers are down? Do they retry sending? How many times? Do we use exponential backoff?
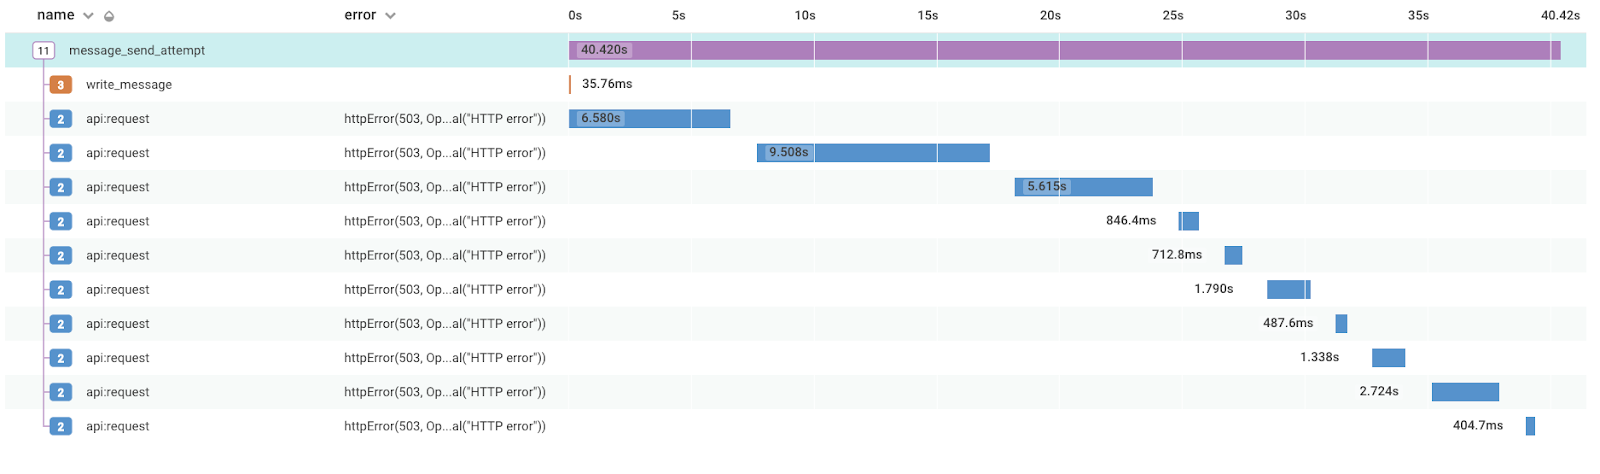
Here is a trace that was collected during the above incident simulation. You can see that our client made 10 API calls during a 40 second time window, without much of a break between calls. This isn’t what we want to happen when our servers are already overloaded, which we can tell by the 503 status code we’re receiving. After seeing this information we’ve updated our logic to use exponential backoff so that next time we’ll be better prepared.
Leveraging metadata
Sometimes spans are slow and it’s hard to understand why. One approach may be to add more child spans, but at a certain point too many spans are hard to reason through and it makes the trace more expensive for the client. Another approach is to get more out of the spans we already have by attaching useful metadata.
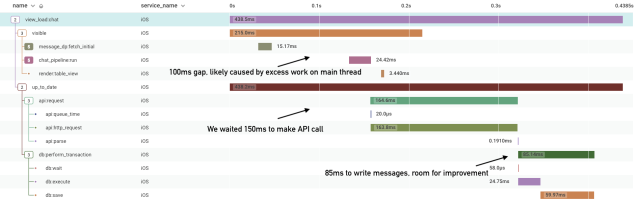
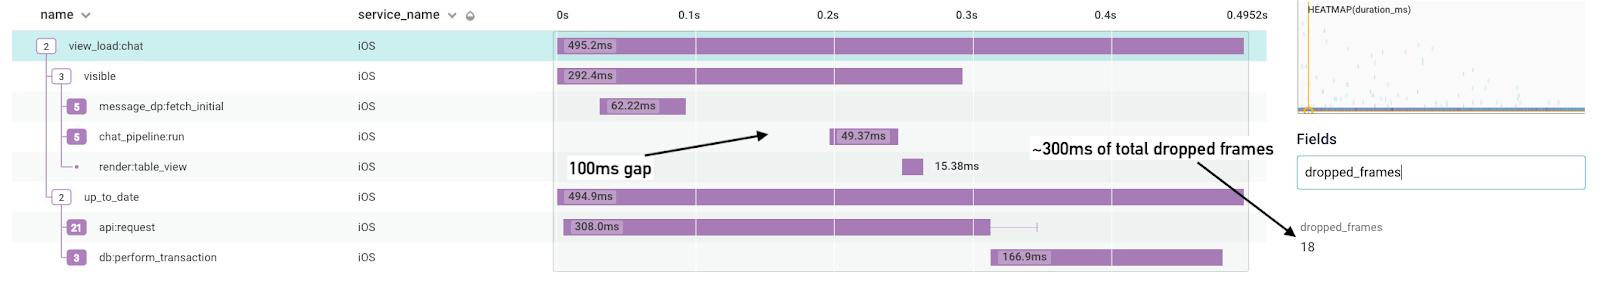
Dropped frames
Sometimes we would come across traces with an unexplained gap between spans, and assume it was due to too much work happening on the main (UI) thread. For situations where we’re main thread bound, the best course of action is to run the feature through a local profiler (like Instruments, Android Profiler, or Chrome Dev Tools) and either move work off of the main thread or make it more efficient. We found ourselves making the assumption that this was the issue quite often, but we weren’t always right. To add extra clarity to the traces, we made it so that every trace is automatically decorated with the total number of dropped frames that occur during the trace. Dropped frames happen when the main thread is busy for longer than 16ms and are most often associated with choppy UI. They’re also a great indicator that we’re doing too much on the main thread.
Because all span tags can be independently queried to form their own metrics, we’re also able to aggregate dropped frame percentiles across our different traces. We often use this information to determine which of our view loads are bound by main thread performance so we can better prioritize projects that improve user-perceived latency.
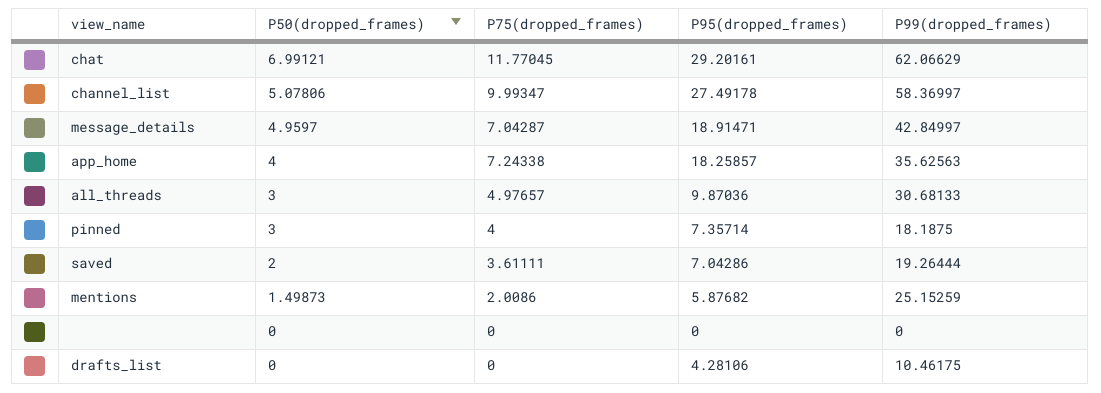
Database Transaction Information
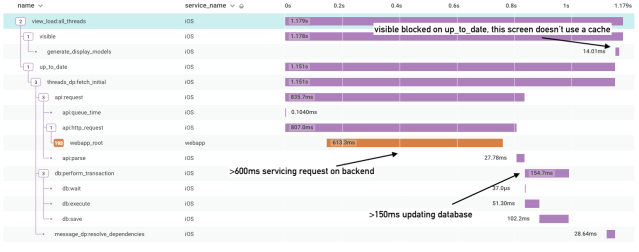
Knowing how database access contributed to performance was eye-opening for a lot of the interactions in the client. We realized quickly though that having no context into what was happening in the database transaction made it hard to know why things were slower for some users than others. Being able to record individual SQL calls would have been really powerful, but we found it to be unrealistic for operations that made potentially hundreds of calls to the database. Instead we leveraged tags to decorate database transactions with the number of times different tables were read from or written to.
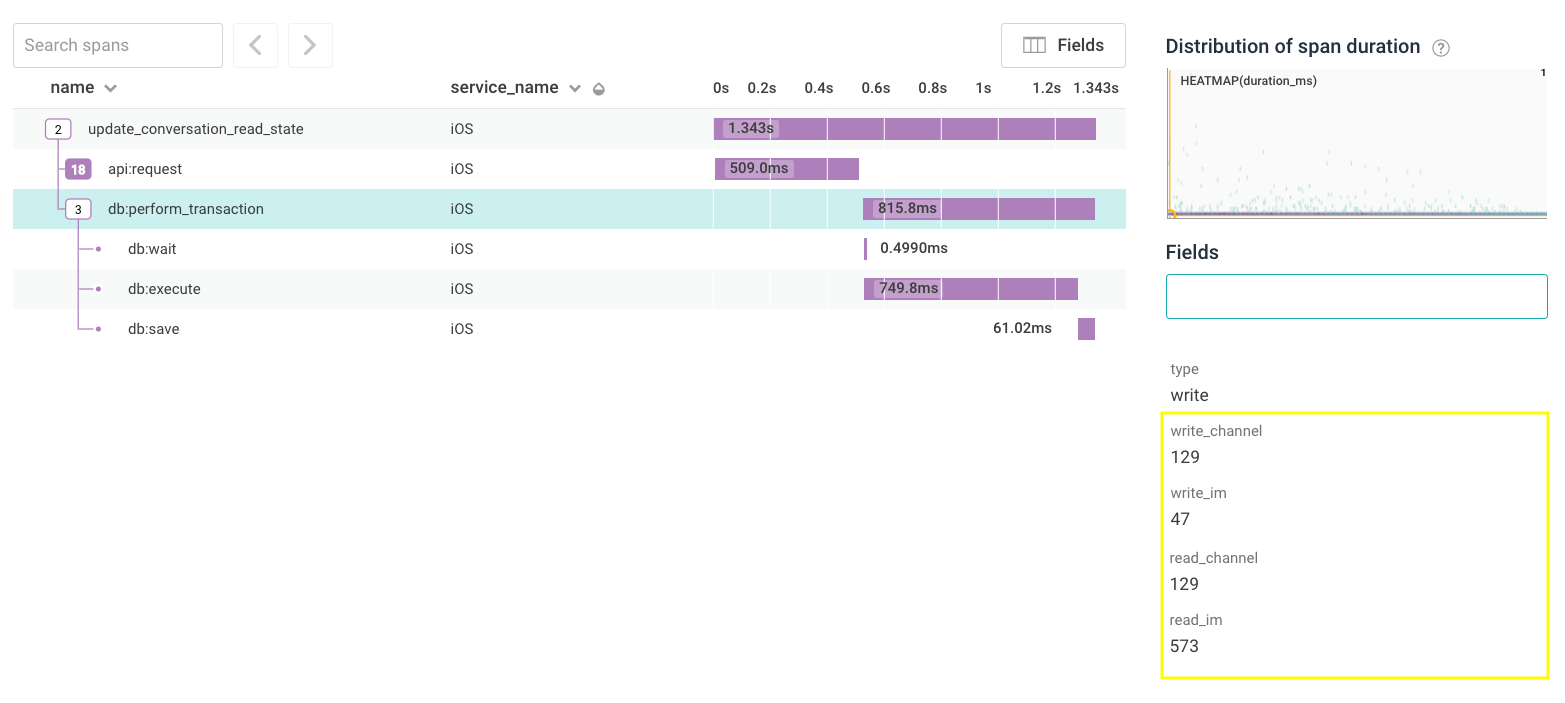
Concretely, we saw that some users took way longer than we expected for their channel list to update. Above you can see a trace for this operation. It’s a simple one that we described earlier in this blog post —- we make an API call and update our database with the results. To take our new <span style="font-weight: 400;">db:perform_transaction</span> metadata for a spin, we pulled up one of those traces. The first thing we noticed is that the user is a member of 129 channels, and all 129 get updated — looks good. The next thing we noticed is that even though we only updated 47 direct messages, we fetched almost 600 of them from the DB! Even though we only show a handful of direct messages in the channel list, the app was loading every conversation the user had ever had. After resolving this issue, we saw the performance for these p95 cases drop by almost 40%.
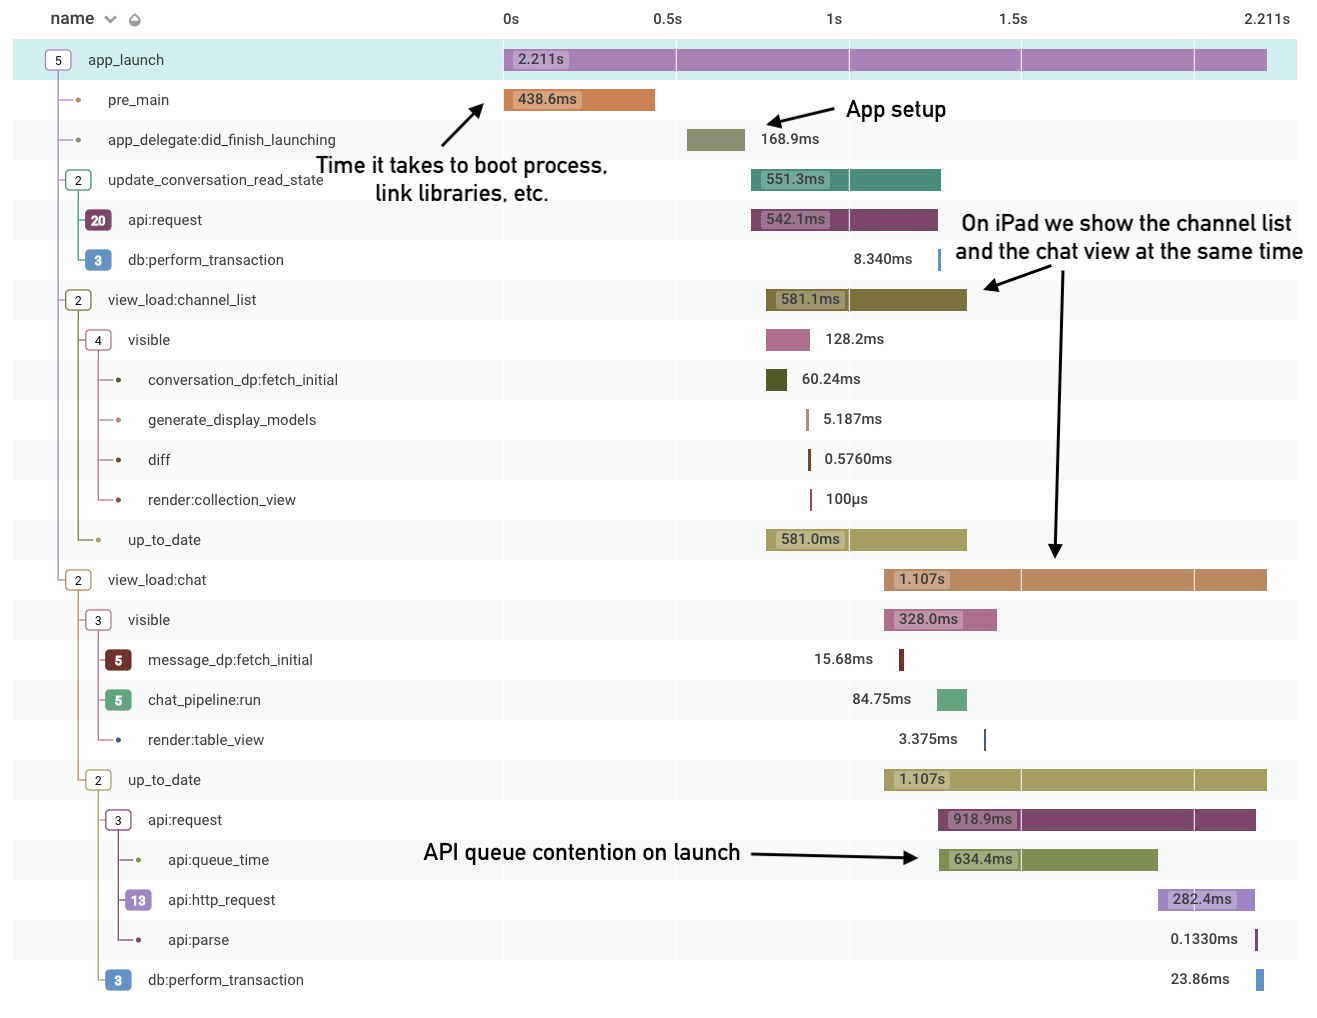
Tracing complex operations
Most of our above examples are small, simple interactions in the app. Tracing thrives just as well in more complex situations, where lots of different things are happening at the same time. Below is an example that’s near and dear to every application — our launch trace! We leveraged our existing view-load tracing to define launch as complete once the view load times for all views on the screen have completed. Classic performance tooling allows you see which functions are taking up the most CPU time during something like launch, but what can be exceedingly difficult is understanding how different concurrent operations interact with each other. It’s been fascinating to see how things like pre-main time compare with the rest of launch, how many different views are created, and even how API queue contention can cause performance issues on boot.
Conclusion
In this post we outlined how we used the existing distributed tracing technology at Slack to solve real problems on our iOS, Android, and desktop clients. Tracing adds causality to our logs, making them inherently actionable in a way that they never were with simple events. Explicitly modeling common actions on the client like making an API call, writing to a database, or loading a view brings consistency to our traces so that developers are able to easily interpret them. With over a billion logs per day across almost 100 distinct traces our developers are already able to have a deep understanding of application performance in the wild using tracing. We’re just getting started here but we’re excited to see what we’ll be able to do next! If you love solving these kinds of problems, come join us!


