


In the first installment of the article, we examined why we built a React analytics library. We also looked at how we use the library to share data efficiently, log smarter impressions, and simplify event logging.
In this second part of the article, we will focus on how we abstracted the library for use by any team at Slack, along with powerful history tracking and live data viewing features.
In the following Abstract PropType Type-Checking and Custom Payload Data Shape sections, we demonstrate how to create customizable data objects and payloads with built-in validation and static typing. In Keeping a History, we look at how we record logs as a user navigates through the app, improving our data context. In Building a Viewer, we examine how we created a live log-viewer to gain visibility into the data. Finally, in the Impact section, we look at the adoption and potential effect the library has had at Slack. Let’s go!
Abstract PropType Type-Checking
You may have noticed in our previous installment that we ignored PropTypes in our example code. The reason for the evasion is that there is a bit of complexity, so let’s tackle it now.
If you’re not familiar with using React PropTypes, you can read up on them here. But basically they provide type-checking for information passed between React components.
We need our library to be flexible enough to allow the different teams using it to define their own data tag props (i.e. key-values that will provide log data, e.g. page: ‘home’) and payload structure. So we can’t “hardcode” our props. Instead, let’s create a configuration to allow teams to define their own data tag props. We want the prop configuration to look like this:
import PropTypes from 'prop-types';

export const dataTagPropTypes = {
   page: PropTypes.string,
   section: PropTypes.string,
   component: PropTypes.string,
   action: PropTypes.string,
   elementType: PropTypes.string,
   elementName: PropTypes.string,
   elementIndex: PropTypes.number,
   // etc...
};
Now that we have a configuration for our data props, let’s use it in our Log component:
import PropTypes from 'prop-types';
import { dataTagPropTypes } from './configuration';

const propTypes = {
   children: PropTypes.node,
   logImpression: PropTypes.bool,
   validateTagPropTypes(props) {
       PropTypes.checkPropTypes(dataTagPropTypes, props, 'prop', 'Log');
   },
};

const defaultProps = {
   children: null,
   logImpression: false,
};
What?! We’ve abstracted proptype-checking? Yup, React lets us do that with PropTypes.checkPropTypes! We import our <span style="font-weight: 400">dataTagPropTypes</span> configuration into Log and, in Log’s <span style="font-weight: 400">propTypes</span>, run it through <span style="font-weight: 400">checkPropTypes</span> (<span style="font-weight: 400">validateTagPropTypes</span> is called automatically). Now anyone who uses our library can customize their data tag keys and types however they see fit. Awesome! By type-checking our log data props, we greatly reduce data errors. More awesome!
Custom Payload Data Shape
So far, we’ve assumed that the data payload <span style="font-weight: 400">sendLog</span> sends to the backend is flat. But what if a team needs to nest its data tags in a custom shape? Continuing our example, say we want to nest our <span style="font-weight: 400">action</span>, <span style="font-weight: 400">elementType</span>, and <span style="font-weight: 400">elementName</span> data tags under a key named <span style="font-weight: 400">ui_properties</span>. We can add a <span style="font-weight: 400">shape</span> object, which will provide the payload structure for our log. We can have any key-value structure we want:
export const shape = {
   page: 'page',
   section: 'section',
   component: 'component',
   ui_properties: {
       action: 'action',
       element_type: 'elementType',
       element_name: 'elementName',
       element_index: 'elementIndex',
   },
};
In our <span style="font-weight: 400">shape</span> configuration, the values are the string names of data tag props.
Now that we have a shape, we need to flatten it into paths so we can programmatically create our payload. We’ll run it through a flattening function (example here), to get this:
{
   page: 'page',
   action: 'ui_properties.action',
   elementType: 'ui_properties.element_type',
   // etc...
}
After we have finished building our flattened shape paths, we are ready to recreate the custom payload shape. To do that we need to write some code. Let’s wrap our original <span style="font-weight: 400">sendLog</span> function with that code:
import { set, forEach } from 'lodash';
import { shape } from './configuration';


export const sendLog = (props) => {

   const finalPayloadShape = {};

   forEach(props, (propValue, propKey) => {
       if (propValue) {
           const tagPath = shape[propKey];
           set(finalPayloadShape, tagPath, propValue);
       }
   });

   // our original pretend sendLog function
   console.log('sending log:', finalPayloadShape);
};
We iterate through the data tag props passed into <span style="font-weight: 400">sendLog</span>. For each prop, we use the flattened <span style="font-weight: 400">shape</span> object to get the path for the tag. With the path, we use lodash’s <a href="https://lodash.com/docs/4.17.15#set"><span style="font-weight: 400">set</span></a> function to recreate the desired payload structure.
By having a configured payload shape, we guarantee that data keys are named and nested correctly and sent to the data warehouse in a consistent, structured manner! ![]()
Keeping A History
In the previous sections, we learned how to fire a basic log event. Now let’s cover another useful case: Log history. Imagine we log a page impression, but we also want to know how the user arrived on this page. Impressions are useful, but having this extra information can help drive a deeper understanding of how users are navigating within our app. Maybe one particular button on a page is clicked more often than another button that leads to the same page. Sure, we could examine the click event logs, but unless we also add the button’s intended href to the log’s data payload, this information might not be easily accessible.
What if we store the most recent log event as it occurs? That way, we can enrich the next impression we log with data from the referring event:
{
   page: 'home',
   action: 'impression',
   referring_data: {
       page: 'settings',
       section: 'header',
       action: 'click',
       elementType: 'button',
       elementName: 'go home',
   },
}
In the example above, the log data contains a key called <span style="font-weight: 400">referring_data</span>. This object contains all the previous event’s data. Now when we analyze our data later, it is immediately obvious how the user landed on our page: from the header section of our settings page, as well as which button!
So how can we get this data without lifting a finger? Simple: let’s use the browser’s <a href="https://developer.mozilla.org/en-US/docs/Web/API/Window/sessionStorage"><span style="font-weight: 400">window.sessionStorage</span></a> to store the last event log. You might be thinking: why can’t we simply cache the last log event locally and read it on the following event? While this will work for single-page applications, it will not work when navigating between multiple applications that have their own internal storage (this may be specific to Slack’s use-case and will not apply to everyone). Using <span style="font-weight: 400">window.sessionStorage</span> allows the data to be retained in browser memory, so long as the same session is used. When the current tab or window is closed, any stored data is cleared.
Building a Viewer
Up to this point, we have shown how the library is capable of tracking different types of user events and how easy and flexible it is to configure these events. Now let’s take a look at how we expose these events so anyone can see the logged data.
When we started defining the library, we knew it had to offer a way to visualize the different log events configured on a given page or component. We wanted to allow anyone to easily access these events without requiring any specific knowledge of or access to the actual code. So, we implemented a simple log-viewer tool to allow visualizing this data.
The log-viewer tool is included in the library and automatically generates a visual representation of not only the configured log events but also the events as they get triggered by the user.
The log-viewer can be enabled on any page on which this logging library is being used. Once enabled, the viewer will render a series of pulsing dots next to each component which has been configured to log an event, allowing you to easily visualize which events will be logged. (To make accessing the log-viewer easy, we created a simple keyboard shortcut to activate it.) Clicking on one of these dots will show the information tracked by that specific component. Here’s how this looks in some of our menu options within Slack:
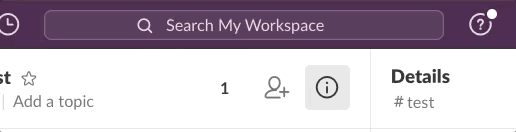
On the image above, you can see the pulsing dots indicating the presence of a configured log event on those menu options. Let’s now view the information we get when we click on one of them:
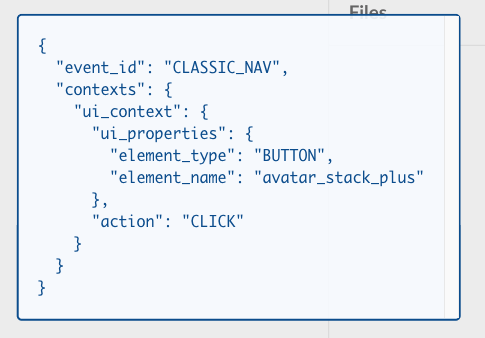
By clicking on one of the pulsing dots, you view the specific data logged by that particular event. Moreover, the log-viewer will also render a list with all the events that have been triggered so far on that page. This list will show new events as they continue to occur on that specific instance. That provides us with a real-time view of all events as they are triggered. Here’s how it looks when we react to a message:
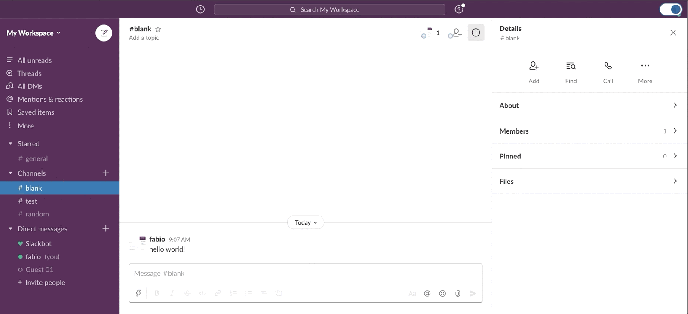
As we interact with these components, the library tracks all triggered events and shows them in the UI, making it explicit which log events are being tracked.
Creating these visuals was actually not that complicated. The library knows the exact location of each configured log event, so it is able to render an additional log-viewer component (pulsing dot) on each of these components to indicate the specific log event data. Moreover, the library is able to display the live event list by keeping track of every log event that has been triggered. It does this by storing these events in a single array shared among all components. This is possible thanks to the same React Context API instance (e.g. <span style="font-weight: 400">LogContext</span>) that we used to share library data props as we describe in the previous blog post.
Impact
This library has been a tremendous help in the way we log user events. We are now able to track detailed and high-quality data with minimal effort. Let’s review some of these benefits in more detail:
The library has significantly improved developer productivity.
Because the library abstracts a lot of the complexity involved in logging user events, developers are only required to provide some minimal configuration to set up logs for a given component.
Thanks to this ease-of-use, we’ve seen a 66% decrease in the amount of lines of code required to implement these logs. Similarly, we have seen a 75% decrease in the amount of development hours spent setting up these logs. These are huge savings!
This library has also significantly improved data quality.
Because the library programmatically generates and validates the event data it generates, it guarantees that we collect and persist consistent and more accurate data. This should allow for easier and more detailed data analysis.
Finally, the library improves visibility.
The built-in log-viewer allows almost anyone to quickly access the log events that are configured in our components. This quick and reliable access to log events should facilitate more interactions between teams that want to check exactly what data is getting logged.
We hope you enjoyed this two part series about how we built a React Analytics Logging Library. We will continue to improve this library to cover more use cases around logging user events at Slack. And we’ll make sure that we share more details and lessons as we invest more in this area. If this is a problem that you are interested in helping us solve, please join us!


