Slack is an integral part of where work happens for teams across the world, and our work in the Core Development Engineering department supports engineers throughout Slack that develop, build, test, and release high-quality services to Slack’s customers.
In this article, we share how teams at Slack evolved our internal tooling and made infrastructure bets. If your team is looking to make data-driven infrastructure decisions, and iteratively roll out changes by focusing on observability (metrics, events, logs, and tracing), then this post is for you. Fundamentally, observability—as an organization-wide culture and practice—helps you answer questions.
Introduction
Slack invested early in CI development for collaboration. CI is a development methodology that requires engineers to build, test, and integrate new code regularly to a shared codebase. Integration and verification of new code in a shared codebase increases confidence that new code does not introduce expected faults to their customers. Systems for CI enable developers to automatically trigger builds, tests, and receive feedback when they commit new code. Our department’s teams focus on concerns like the stability and throughput of our CI systems to ensure Slack customers have a simple, pleasant, and productive experience.
What does CI at Slack look like?
Slack evolved from a single webapp PHP monorepo (now mostly in Hacklang) to a topology of many languages, services, and clients to serve different needs. Slack’s core business logic still lives in webapp and routes to downstream services like Flannel. CI workflows at Slack include a variety of tests like unit tests, integration tests, and end-to-end functional tests for a variety of codebases.
For the purposes of this article, our focus is on webapp’s CI, as this is where most engineers at Slack still spend the majority of their time. The webapp CI ecosystem spans Checkpoint, Jenkins Build / Test executors, QA environments (each capable of running Slack’s webapp code base that routes to supporting dependent services). Checkpoint is an internally developed service that orchestrates CI and Continuous Deployment (CD). It provides an API and frontend for orchestrating stages of complex workflows like test execution and an asynchronous job queue system. It also shares updates in Slack to users for things like test failures, PR review requests, and deploys.

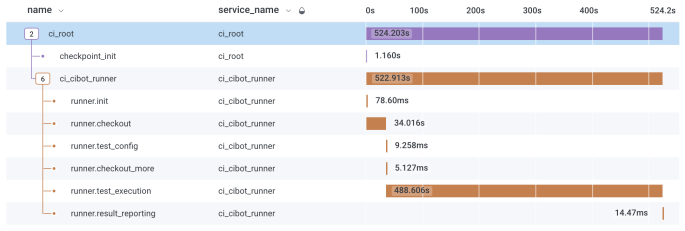
An example workflow of an end to end webapp test is shown above. A user pushes a commit to Github, Checkpoint receives webhooks from Github for codebase-related events, like a new commit. Checkpoint then sends requests to Jenkins for build and test workflows to be performed by Jenkins executors. Inside Jenkins builder and test executors, we use a codebase affectionately called cibot that shallowly executes build and test scripts (and that communicates with Checkpoint for orchestration and test result posting).
Where are the challenges? How might we change the curve?
Over the last 7 years, Slack has grown tremendously in customer count and code bases. While this is exciting, there’s a shadow side to growth, and it can lead to increased complexity, fuzzy service / team boundaries, and systems stretched to their limits. Many internal tools were built quickly and with just enough resiliency to support customers’ and Slack’s main monorepo — webapp.
The first test results were recorded through Checkpoint in April 2017. Between that date and April 2020, we saw an average of 10% month-over-month test suite execution growth.
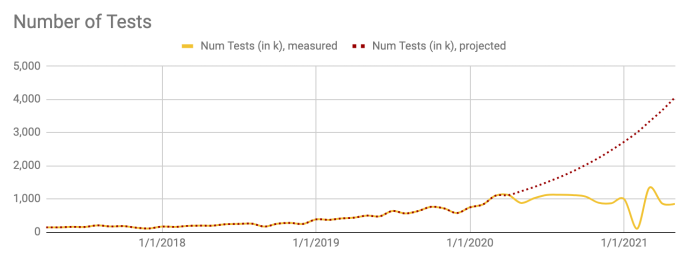
This graph is derived from an analytics dashboard used to look at test execution metrics related to the infrastructure, like number of test executions, errors, flakes, timeouts. We use dashboards like this to analyze the developer experience with views for reliability and performance of specific dimensions, like flakiness per suite, time to mergeable, and cycle time.
We understand curve changes using these dashboards. We create project hypotheses and scope potential project impact through observability through metrics, monitoring, and traces.
Understanding impact on large-scale end-to-end changes is really hard in distributed systems. We’ll talk through three types of curve changes:
- Adaptive capacity decreased the cost of each test by changing the infrastructure runtime.
- Circuit breakers decreased the number of tests by changing the infrastructure workflow.
- Pipeline changes decreased the number of tests by changing our user workflows.
Adaptive capacity
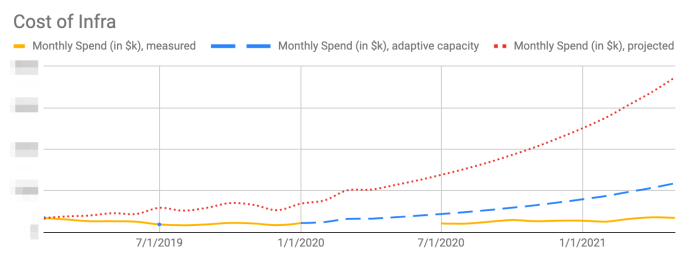
We modeled how users were using CI and crafted a strategy to increase overall throughput and reduce errors at peak usage through parallelization. We experimented with configurations of instances to understand workload performance and resiliency using end to end metrics. This allowed for an overall increase in total fleet capacity (through oversubscription of executors per instance) while reducing costs by approximately 70% and decreased error rates by approximately 50% (compared to the previous executor and instance type metrics).
One project started from a simple request from Slack’s cloud infrastructure team: “Could you all update your instance types from an older generation AWS compute-optimized instance to a newer instance type? We expect to see approximately 10% cost savings and increased performance.” We started scoping and built a few simple dashboards to understand what we were working with. We discovered a heterogeneous fleet of instance types across types and generations, which is not ideal. We also found our workloads were extremely spiky, e.g. every day at 1 pm Pacific, we saw a deluge of user requests and, occasionally, infrastructure faults due to overwhelmed infrastructure.
We started experimenting to better understand constraints and trade offs, in order to develop a strategy. Corey Quinn summarized the experience of many infrastructure engineers that right sizing your instances is nonsense—basically, dependencies might not work between hypervisor / os / version interactions and idealized instance types requires detailed benchmarking. Given the changing diverse nature of CI workloads (across code bases and many teams), there might never be an ideal instance type for all workloads.
Given these constraints, we discovered a few tenets to guide our exploration:
- Let’s increase total fleet capacity at peak to account for spiky workloads
- Let’s decrease total fleet maintenance with a consistent instance type across workloads
- Let’s measure user experiences using end to end metrics for performance, resiliency, and cost per test
We designed for adaptive capacity, a concept for including excess, unused capacity that could be flexibly used during incidents and new peak events. We also wanted to increase the cost effectiveness of CI by using a strategy called oversubscription. Previously, most of the CI fleet only maintained a single executor, allowing no parallelization. Oversubscription is a strategy to increase utilization of a limited resource, like CPU, by increasing the number of parallel work and maximize usage of this resource. In CI execution, workload completion is typically limited by CPU.
We hypothesized we could increase overall system throughput of this limited resource by increasing parallelization without decreasing performance while non-compute heavy tasks were performed (like network calls to downstream services).
We performed profiling across four representative builds and test suites to confirm we could increase parallel executions without increasing time outs and errors, with minimal effect on performance. For some CI builds and tests, we had to work with users of CI (e.g. test suite owners) to parallelize workflows that previously assumed a single executor per instance for builds / test execution.
We used a method for end-to-end profiling across compute-intensive instance types of varying vCPUs (most builds / tests are compute limited as opposed to memory or network limited) and executor count (1 vs 2 vs 4). This let us build a naive model for a continuous stream of work for these profiles (a combination of vCPU and executor count) based on how users might completely fill the pipeline at full capacity. We concluded by evaluating candidate profiles that showed no errors and finding an ideal tradeoff between cost and performance (vCPU x executor count). E.g. a c5.9xlarge instance with 4 executors did not introduce additional faults and performance degraded 5% between 2 and 4 parallel executors. We aim for 50% busy executors at peak to allow for additional capacity during peak workloads.
Circuit breakers
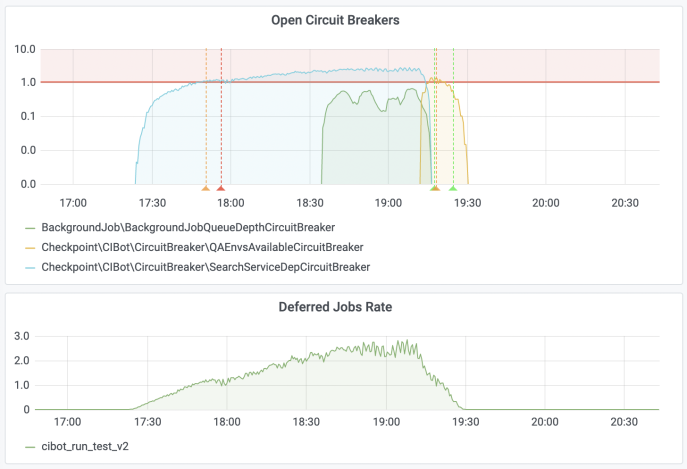
We added circuit breakers in our CI orchestration platform for downstream services and user workflows. These change the cumulative number of tests we execute in CI that will likely result in faults or unnecessary work. Software circuit breakers are a concept borrowed from systems engineering that detect faults in external systems and stop sending calls against the known faulty system. These breakers then periodically probe the external system for recovery and allow calls and CI to continue normally.
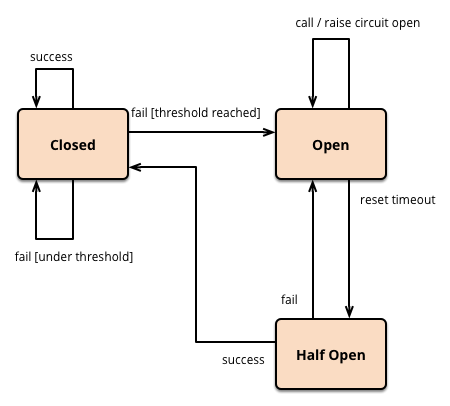
In CI, user workflows are of high criticality where any failed / dropped request represents developer frustration. We took an approach to defer or cancel work. When we detect a downstream system is having an issue or detect CI jobs that are no longer required (e.g. a user pushes another commit to their branch) we change the CI workflow.
Prior to this work, cascading failures would frequently affect the CI pipeline (frequently starting from webapp issues), leading to multi-day severity 2 (our high severity just below an outage) incidents, impacting developer productivity across Slack, and causing the internal tools teams to scramble. Historically webapp engineers and test suite authors/owners had no insight into performance or resiliency of the underlying test infra, leading to inaccurate attribution and escalation. Circuit breakers stabilize system throughput, leading to a better developer experience—engineers experience fewer flaky failures in CI, and they are not forced to manually re-run failed tests. We created software circuit breakers for internal CI services like Jenkins, Github commits, and Checkpoint’s job queue as well as services that CI at Slack relies upon, like Flannel, Vitess, and Search. These circuit breakers surface in team alert channels and in our CI frontend to give awareness to users and operators when a downstream service is in a degraded state.
Pipeline changes
Flaky test executions were a top reported developer productivity limiting issue for multiple quarters by mid-2020 and represented substantial CI infrastructure spend. In an earlier body of work, our internal tooling teams were able to understand challenges in distributed systems by improving observability through tracing deployed code in CI. More details on CI trace implementation and integration of trace telemetry into Slack workflows can be found in this conference talk, How Tracing Uncovers Half Truths in Slack’s CI Infrastructure.
Observability through tracing drastically increased the consistency and reduced the flake rate of these test executions. To create pipeline changes, our team worked with customers of CI to understand test executions with trace instrumentation. By doing so, we were able to decisively reduce developer frustration waiting for flaking test executions to execute as well as the infrastructure time and spend for executing faulty code by reducing the number of test executions.
At peak flakiness in late 2020, Automation teams across Slack held a daily 30-minute triage session to triage and focus on the flakiest test suites. Automation team leads hesitated to introduce any additional variance on how we use the Cypress platform, an end-to-end test framework. The belief was that flakiness was from the test code itself. Yet there wasn’t great progress by focusing on the individual tests and suites.
We came together to create a better attribute causation from flaking tests and instrument how we used the Cypress framework with traces. After some negotiating and identifying no verifiable decrease in performance nor resiliency from initial executions, we scoped a short experiment: our collective group would instrument the high-level platform runtime with traces for a month to capture runtime variables.
Within a week, we discovered a few key runtime variables that correlated very strongly with higher flake rates. In this graph, you can see compute hours spent on just flaky runs. At peak, we were spending roughly 90k hours per week on very large, very expensive machines—on tests that were discarded because results were flaky. To build confidence and address concerns at every merge and hypothesis test, we cued up a revert PR at the same time. We never reverted.

Takeaways
This article presented a series of iterative bets on understanding infrastructure then making observability-informed workflow decisions that spanned multiple teams and workstreams. We hope these stories highlight how a curiosity about data created new abilities for our teams to build better internal tools and to drive a magnitude change in infrastructure spend.
To summarize, we drove a magnitude change in our CI infrastructure spend by using three ideas:
- Adaptive capacity to decrease the cost of each test by changing the infrastructure runtime.
- Circuit breakers to decrease the number of tests by changing the infrastructure workflow.
- Pipeline changes to decrease the number of tests by changing our user workflows.
Finally, this work could not have happened without plenty of teamwork to make the dream work! We’d like to share a special thank you to Kris Merrill, Sandeep Baldawa, Marcellino Ornelas, Scott Sandler, Sylvestor George, Travis Crawford, Suman Karumuri, Luiz Gontijo, and Bryant Ung for shaping and building key understandings in these projects.
Can you help Slack understand tough problems and shape software bets together? Check out our engineering jobs and apply today: https://slack.com/careers/dept/engineering


