Complex systems are difficult to reason about at scale; we often can’t accurately extrapolate system behavior and performance, so we need to derive that data empirically. We use load testing to do just that: find the limits of our systems and weed out bugs at a large scale in a controlled environment. Slack is a pretty complex system — whether you’re triggering a workflow for thousands of members or uploading a file into a thread, everything is interconnected! The technology required to give our users the experience of sending a message and having it instantly appear in potentially millions of clients is very challenging to build and test at scale. To adequately load test our systems, we needed to build a tool that was both realistic and cost-efficient in how it mirrored actual user traffic and behavior.
At a high level, a Slack client does three things:
- Sends API requests to our webapp backend. This can also kick off asynchronous jobs in our job queue.
- Sends and receives real-time events over a websocket connection (e.g. presence changes and events such as users typing). Learn more about how our websocket messages work in this blog post.
- Sends API requests to Flannel, our edge cache service.
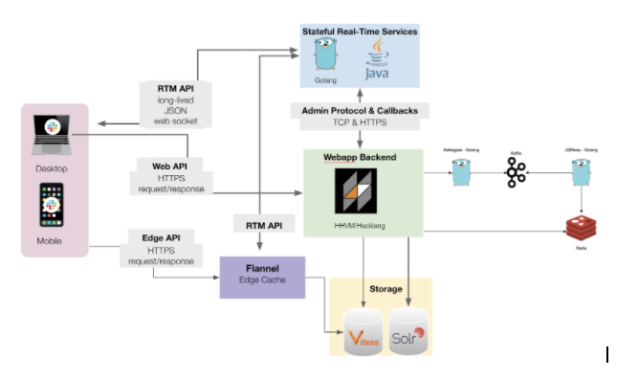
As an example, the seemingly simple act of sending a message goes through quite the journey. First, a connected client calls the Web API chat.postMessage. This is sent to our backend which queries our real-time services stack for a timestamp and writes the message to the messages table in Vitess. The backend also kicks off an asynchronous processing job (which handles things like expanding previews for links and attachments) and finally sends an event through our real-time services stack to all the connected clients in the channel via their active websocket connections.
Unfortunately, modeling these intricate interactions in our clients and their impact on our systems isn’t easy. Prior to building Koi Pond (our main load-testing tool today), we’d already developed multiple solutions, each of which had its pros and cons and none of which tested all three of the high-level client actions in a scalable way.
One of these tools, Puppet Show, spins up headless Chrome browsers which point to slack.com across a Kubernetes cluster and execute a simple script of commands; while this tests our backend systems as well as our real-time services stack, this is both extremely expensive and did not easily scale. Our implementation requires each cluster to be manually spun up, taking us an entire day to reach 150,000 simulated users.
Another tool we built, API Blast, calls a specific API endpoint via URL at a specified rate (we go into more detail about API Blast here); the limitation here is that we can only call a single endpoint at a time and we are unable to load test the real-time services stack via connected clients.
There were two specific problems we were trying to solve when building Koi Pond:
- Load test both our backend services and our real-time services in a cost efficient way.
- Add the ability to realistically mimic the specific performance concerns we have at Slack related to scale, including thundering herds, massive message fan-out, and unbounded datasets.
Koi Pond
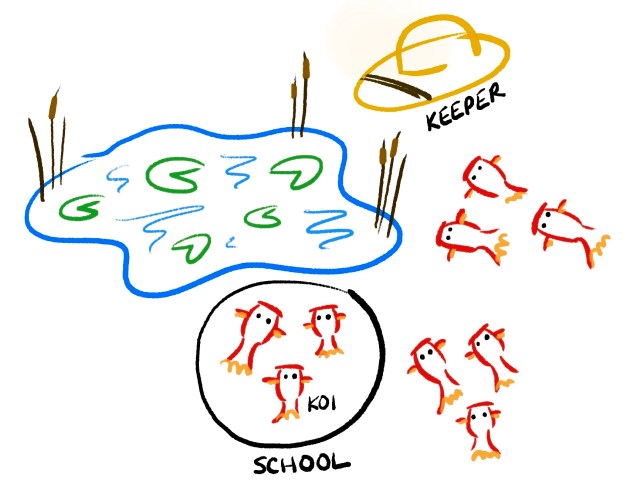
Koi Pond is a tool that spins up slimmed-down versions of Slack clients, which we call koi. A koi does two things: establishes a websocket connection and sends API calls (exactly like our real clients do!). Each koi belongs to a school which is a program that controls a group of up to 5,000 koi. The schools poll the server (which we call the Koi Keeper) for work periodically. We define two kinds of work: behaviors and formations, which we’ll describe in greater detail below.
Behaviors
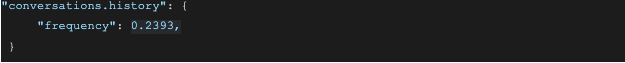
A behavior is an action that koi perform at a given frequency. A behavior usually consists of calling a single Slack API (for example,conversations.history), but can also perform multiple calls if they’re dependent on each other. We came up with a simple structure to define these behaviors, as can be seen below for the conversations.history example.
The structure has two parts: a frequency definition based on an API’s typical usage in a specific production team, and the sequence definition with the arguments for the API call, which we’ll dive into more detail with our example below. We upload a configuration file with behaviors for each of the APIs that we’re interested in and that behavior is scaled to the number of koi that we boot.
Let’s walk through an example of the behavior for conversations.history.
In the frequency section, the configuration tells us that in a given minute in our internal Slack workspace, there is a 0.2393, or 23.93%, chance that a user will call conversations.history. Our koi will call conversations.history at this same frequency. While there are benefits to load testing to find the breaking points of our systems, we found it valuable to call APIs at a realistic rate to simulate regular usage patterns to prepare for customer launches.
In the below configuration, you can see that a sequence has a few different components. The syntax for the sequence configuration files is in the Golang standard template library:
docis our documentation of the behavior and each of its steps.pre_actionsare the steps we need to take before the API is called. In this example, you can see that we try to setcurrentChannelas a random channel from the koi’s local store. If we can’t find a valid channel, we halt the sequence.requestis the heart of the sequence and where we make the actual network request. We define it with the commonly used arguments called by real users in production teams.post_actionsare the steps we need to take immediately after the API is called. In this example, we add to the koi’s local storage of messages and user IDs.
![Screenshot of a JSON file with the following content: `"conversations.history": { "doc": "Calls the conversations.history API endpoint with a random channel", "steps": [ { "doc": "Get a random channel. Halt if no channel is found, otherwise call conversations.history", "pre_actions": [ "{{ set \"channel\" (randomChannel false) }}", "{{ if (not (get \"channel\")) }}{{ halt \"no random channel found\" }}{{ end }}", "{{ setCurrentChannel (get \"channel\") }}" ], "request": { "type": "api", "method": "conversations.history", "args": { "channel": "{{ (get \"channel\").ID }}", "limit": "42", "ignore_replies": "true", "include_pin_count": "true", "no_user_profile": "true", "include_tombstones": "true" }, "post_actions": [ "{{ addMessages (get \"channel\").ID .messages }}", "{{ set \"user_ids\" (extractStrings .messages \"user\") }}", "{{ addUserIDs (get \"user_ids\") }}" ] } } ] }`](https://slack.engineering/wp-content/uploads/sites/7/2021/04/Screen-Shot-2021-04-21-at-4.02.47-PM.png?w=628)
Formations
A formation is a set of outbound network requests (API calls or websocket messages) for a percent of koi to execute within a specified amount of time, that are meant to simulate a real workspace’s thundering herd behavior (for example, a large number of users flipping to an organization-wide channel, reading the latest message, and reacting to it). This is in contrast to behaviors which run on all koi at the specified frequency in the configuration file. Formations allow us to more realistically test the effects of mass user actions on our systems. These actions aren’t called in isolation, so this gives us a better example of the load of our system in the event of many users taking the same action at the same time.
For example, with our API Blast tool, if we wanted to test the effect of users flipping to an announcements channel and viewing and reacting to a message, we would be limited to calling the reactions.add endpoint at a specified rate. While this would test our backend systems (e.g. the database and job queue), we would not experience a downstream impact on our real-time services stack (e.g. the millions of reaction_added events that would flood the websockets of our connected koi).
In contrast, see the below formation example where we can test out the realistic load of each user viewing a message, marking the message as read, and finally calling reactions.add. In the metadata, you can see that we have specified that within six minutes (the begin_within_secs value is 360), 10% of all the booted koi will carry out this set of actions.
![Screenshot of a JSON file with the following content: `{ "name": "Viewing and reacting to a message in Announcement Channel", "begin_within_secs": 360, "percent": 10.0, "sequence": { "steps": [ { "request": { "type": "api", "method": "conversations.history", "args": { "channel": "{{ get \"channel_id\" }}", "limit": "28", "ignore_replies": "true", "include_pin_count": "true", "inclusive": "true", "no_user_profile": "true" }, "post_actions": [ "{{ set \"message_ts\" (index .messages 0 \"ts\") }}" ] }, "delay_after_ms": 5000 }, { "request": { "type": "api", "method": "conversations.mark", "args": { "channel": "{{ get \"channel_id\" }}", "ts": "{{ get \"message_ts\" }}" } }, "delay_after_ms": 60000 }, { "request": { "type": "api", "method": "reactions.add", "args": { "channel": "{{ get \"channel_id\" }}", "timestamp": "{{ get \"message_ts\" }}", "name": "{{ pickString (stringArray \"fish\" \"tropical_fish\" \"blowfish\" \"ocean\" \"whale\" \"turtle\") }}" } } }`](https://slack.engineering/wp-content/uploads/sites/7/2021/04/Screen-Shot-2021-04-21-at-4.08.56-PM.png?w=622)
How we used Koi Pond leading up to a large customer milestone
Manual QA combined with Koi Pond
In the month leading up to a large customer’s launch, we ran sessions where our amazing QA (Quality Assurance) team manually tested critical Slack features while we booted up koi that did their background activity. As we mentioned earlier, certain actions in Slack are highly complicated and therefore challenging to precisely replicate. We are working on making Koi Pond as close as possible to the real Slack’s behavior, but in the meantime, manual testing helps us ensure that all the nuanced actions are realistically tested.
Each week, we increased the number of koi we simulated (starting at 5,000 and eventually booting 500,000 in the last session before the customer launch) and improved the fidelity of our testing by making our test workspace as close as possible to our expectation of the actual customer’s workspace. This included adding certain numbers of private and public channels and enabling our EKM (Enterprise Key Management) feature. This helped us identify bugs and bottlenecks that don’t show up well in graphs or alerting, and the regular cadence of testing gave us plenty of opportunities to verify performance improvements and bug fixes.
Example: In one of the default channels in our load-test workspace with 400,000 actively running koi, one of our QA engineers manually tested file sharing. This sent out two websocket messages per user, completely hammering our real-time services infrastructure and had us shut down the test to prevent any production impact. To fix this issue, we increased the splay of real-time servers for the load-test workspace (allowing us to evenly distribute the websocket events across more servers, thus alleviating the load on any one server) and added a performance optimization to the file upload code. Once these changes were implemented, we tested out the scenario again at 1 million actively running koi and barely saw a blip in our graphs. This is a great example of a case that we were able to find in load testing and fix before it had an impact or incident with a real customer.
Other load testing tools combined with Koi Pond
We gave teams the option to have us boot up koi while they ran their API Blast (or ad-hoc script) load test. This gave us the benefit of seeing the load on the websocket and real-time servers.
Example: One of our product engineering teams ran an API Blast load test where they called chat.postMessage at a rate of 50 requests/second while we had 200,000 koi booted. This overloaded our real-time servers and helped us identify a great place to add a rate limit to protect our systems.
Koi Pond on its own, without other load testing tools
With the background behaviors, scaling up koi without any additional API Blast or Formations running still tests our systems in a realistic way. This was a great way to find bottlenecks with regular usage.
Example: We had significant stress on the database namespace used by our monitoring systems when we scaled to 200,000 koi. Our monitoring team was able to scale up the system and add shards manually so that our systems were well-prepared before the large customer onboarded.
In addition to finding bottlenecks, we were able to test out performance optimizations on our load-test workspace (a production workspace we set up exclusively for load testing) with a high amount of background activity. One example of this is migrating the large customer to Vitess — with no issues on our load-test workspace, we were confident in enabling it for the new customer.
Formations
We also ran a few formations in preparation for the launch, to test out large actions that many users take at once. In real life, think of a company-wide AMA or an admin sending a message in an announcements channel.
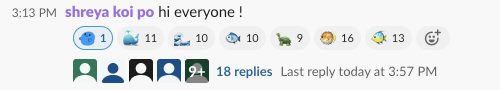
Example: With 1 million koi connected, we had a user send out a message in an organization-wide default channel (that means all the users in the workspace are in this channel and can’t leave), using the example from above. We were able to have 100 users react to the message without causing too much trouble, but at 18 replies in the thread with about a message posted every 6 seconds, our real-time infrastructure was overwhelmed. We learned that we needed to add guardrails in place for this kind of large-channel event while we fix the underlying issues.
Wins
- Koi Pond scales extremely quickly and realistically — our largest test to date has been 2 million users in a single workspace and we didn’t find any major issues or cause any incidents when we hit this milestone.
- Koi Pond is very cheap to run; running 2 million users with Koi Pond is about 0.26% the cost of running 150 thousand users with Puppet Show — that’s 13 times as many clients.
- Koi Pond is extremely safe; it is connected to our emergency-stop mechanism and shuts down within seconds via the Koi Pond UI.
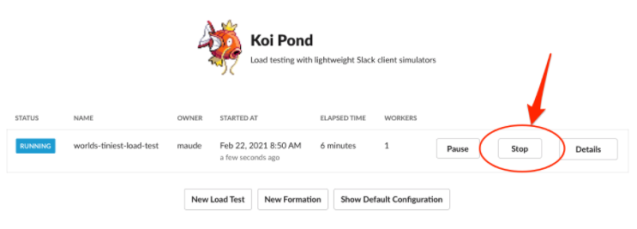 We prioritized safety when building the Koi Pond architecture and made sure to surface the
 PauseandStopsafeguards clearly and intuitively in our UI. In addition, our Koi Pond infrastructure is isolated from production; for example, we have a separate web tier and VTgate (lightweight proxy server that routes Vitess traffic) that routes our load test traffic.
- Being well-prepared made for a really smooth and honestly anti-climactic launch day with our customer. This was great news — it meant all our load testing worked.
Challenges
- Scaling up gradually is key. At one point when we were gearing up for a customer launch, we went directly from 5,000 to 100,000 koi. This ended up causing strain on one of our databases, which could have been prevented if we had scaled up to a smaller number first and seen the gradual increase in load and impact.
- Ensure that our load testing environment is as realistic as possible. This has been a challenge for us since Slack has such a complex and highly distributed architecture; it’s difficult to know all the different nuances that a real workspace has. An example is with one of our API Blast + Koi Pond endeavors — while testing our SSO (single sign-on) flow, we were originally using a single SSO token but calling it at a high rate. We noticed that there were no events coming over the websocket so we retried the test with multiple users’ SSO tokens, and this sent a much higher and accurate number of websocket events for this action. While this didn’t cause any major issues, we would’ve missed testing out the load of this flow on the websocket and our real-time servers if we hadn’t realistically tested with multiple tokens.
- Coordinating with product teams to make sure the tool is approachable, realistic, and safe. We had a few teams volunteer to test out formations on their own features and we were able to gather feedback on what made this challenging for them and improve on the process.
- High fidelity is hard to achieve and something we’re still working on — it’s time-consuming to spread users out in channels and to implement all of the APIs we have. As mentioned earlier, it’s challenging to simulate all of the nuances and flows in the product in a realistic way.
What’s Next?
Koi Pond has allowed us to proactively and realistically test all our systems, while being cost-efficient. We had a successful launch with a large customer and with large milestones since, thanks to the load testing we’ve done in preparation.
Going forward, there are two main ways we plan on building upon Koi Pond. The first is to continuously run koi. Currently, each time we use Koi Pond we boot up all our clients. This process is time consuming and adds a lot of overhead for our team when others want to take advantage of the tool. We are working on a process for having koi running all the time to alleviate these issues and unlock possibilities such as load testing on deploys and more realistic timezone/region testing.
We also plan to improve the fidelity and flexibility of our behaviors. As we mentioned earlier, each Koi Pond test currently runs a single configuration based on a production workspace. We know that Slack usage patterns change depending on timezone, region, and whether they use mobile or desktop. We hope to improve our tool to reflect these user usage patterns easily.
Shout out to the team: Maude Lemaire, Glen D Sanford, Sara Bee, Venkat Venkatanaranappa, and Morgan Jones!
Want to help Slack solve tough problems and join our growing team? Check out all our open positions and apply today.


