


In this article, I will talk about how Slack uses Kafka, and how a small-but-mighty team built and operationalized a self-driving Kafka cluster over the last four years to run at scale.
Kafka is used at Slack as a pub-sub system, playing an essential role in the all-important Job Queue, our asynchronous job execution framework that is involved in nearly every single action a user does on Slack (e.g. unfurling links in channels, sending notifications, notifying bots, updating search indices and running security checks). In addition, Kafka acts as a nervous system for moving mission-critical data across Slack, powering our logging pipelines, trace data, billing pipeline, enterprise analytics and security analytics data.
Slack’s Kafka journey
Back in 2018, several teams adopted Kafka for different use cases. At that time, these teams each ran their own Kafka clusters. As a result, there was fragmentation of different versions of Kafka and duplication of effort, where different teams were doing similar work for deploying, operating and managing Kafka clusters.
We took up a project to standardize all the Kafka clusters under a single version managed by a single team. However, since we were a small team, we also wanted to automate as many Kafka operations as possible.
Today, Slack manages about 0.7 petabytes of data across 10 Kafka clusters, running across hundreds of nodes. We process millions of messages per second across hundreds of topics with an aggregate throughput of 6.5 Gbps at peak. Our Kafka infrastructure costs are dominated not only by hardware but also by the network. Our Kafka consumers range from heavy batch jobs to extremely latency-sensitive applications like Job Queue.
What is a self-driving Kafka cluster?
Kafka is an excellent piece of software that runs on hundreds of nodes at Slack. However, if you’ve ever tried to deploy or manage Kafka, you know it’s no easy task. We were frequently paged for slow, sometimes downed brokers, or capacity management issues.
The goal of automating Kafka operations is to remove the operational overhead of managing Kafka day to day.
To this end, we identified a few common operational tasks for our Kafka clusters, including:
- Routine Kafka admin operations such as creating topics, changing partition counts and re-assigning partitions to brokers
- Capacity planning operations like adding/removing brokers to a cluster
- Operational issues like replacing brokers or deploying new versions of software
- On-call burden to diagnose issues in the Kafka cluster
- Customer support to explain if Kafka consumers are keeping up
So, as we migrated to a new version of the Kafka cluster, we decided to automate the operational aspects of it, or make them self-service.
Note: While most of the solutions in this post may seem common now, we started in 2018 when the alternatives didn’t exist or were not mature enough for our use.
Kafka 2 project
We unified our efforts for a more automated Kafka by using version 2.0.1. Our Kafka setup consists of the following components:
Build, release, provisioning and deployment: Chef and Terraform
We use Chef to manage the base OS, deploying and configuring the Kafka software on the host. Each of our Kafka clusters runs under a different role with its custom config, but they all share the same underlying recipe. We have a Terraform module that creates an ASG for this Chef role in AWS. The ASG manages provisioning and deprovisioning the nodes automatically.
The older Kafka deployments were largely managed by deploying Debian Kafka packages. However, we found deploying pre-built packages to be painful since the provisioning was not always reliable. Further, since we were overriding the default configuration anyways, our Chef recipes were complicated. To address these issues, we created an internal fork of the Kafka repo and set up our CI/CD pipeline to build and release static binaries to S3. Our Chef recipes would then pull the binary from S3 to deploy it, which made provisioning very reproducible.
Traditionally, an Apache Zookeeper 3.4 cluster was manually provisioned since we didn’t have an automated way to ensure that each Zookeeper node has unique IDs and couldn’t assign new IDs without a cluster-wide restart. Manually provisioning Zookeeper nodes is not only tedious (we were paged for routine node failures) but error prone, since we would accidentally launch multiple Zookeeper nodes in the same AWS availability zone, increasing our blast radius. To reduce the tedium and errors, we’ve automated this process by upgrading to Zookeeper 3.6, which didn’t need cluster-wide restarts when replacing brokers. Then we automated the process of assigning unique IDs to Zookeeper nodes via Consul KV when they get provisioned but before they join the cluster. With these two changes in place, we were able to provision our Zookeeper clusters via ASGs using Terraform.
Tuning Kafka cluster stability
While this setup helped automate the pain points in provisioning the hosts, we still had to manage cluster operations like migrating the partitions to the new brokers and re-balancing the brokers for load. Moreover, such cluster management operations were disruptive to our clients and caused them to be paged or miss their SLOs.
After some analysis, we identified that hot spotting in our Kafka cluster was causing the instability. And these hot spots were the result of a few different issues.
We have a couple of hundred Kafka topics that are provisioned across our clusters. We noticed that each of the topics had a different partition count based on the load. During the course of regular operations, some brokers would run hot compared to others. These hot spots in turn would be exacerbated during cluster management operations like addition and deletion of brokers, thus causing our Kafka consumers to be delayed in their consumption.
To fix hot spotting, we wanted to evenly utilize all brokers in the cluster. First, to smooth out the write hot spots, we changed all partition counts to be a multiple of the broker count. We also smoothed out the read hot spots by picking the consumer count to be even across all of the nodes. Together this smoothed out the read and write rates on the cluster. As long as all of these partitions were evenly spread out around the cluster, we would get reliable utilization across the cluster. In addition, as we scaled up the brokers or consumers, we would update the partition count of the topics such that the partition count would still be a multiple of broker count, ensuring even utilization.
Another reason for hot spotting of Kafka clusters was the replication bandwidth consumed during a partition rebalance event. We found that a majority of the resources were consumed by replication bandwidth starving producers or consumers, especially during peak hours. So, we limited the replication bandwidth that could be used by the cluster. However, capping the replication bandwidth resulted in slowing down our cluster management operations quite a bit. We also modified our operations to only move a small number of partitions at a time. This allowed us to make a lot of small changes on a continuous basis.
Despite these efforts, the Kafka cluster would still be unbalanced over time due to partial failures. To automate these changes, we used the excellent Cruise Control automation suite, built by LinkedIn, to automate the cluster rebalance operations and ensure an even utilization of all nodes in the cluster. Overall, these tunings resulted in stable operation of the cluster.
Chaos engineering
Since cutting over from existing clusters is a big change, we ran some chaos experiments while we tested this new cluster in prod using dark traffic.
Our tests involved saturating various resources in the cluster under load. Additionally, we were able to terminate brokers under controlled conditions which helped us better understand the failure modes of our brokers and their impact on producers and consumers.
During these tests we found that our cluster recovery operations were mostly limited by the number of packets per second sent by the host. To support faster recoveries, we enabled jumbo frames on these hosts. Our Kafka instances have some of the highest packets-per-second utilization in Slack’s infrastructure fleet.
In addition, this also helped us identify a few edge case bugs in consumers that used the Go Sarama library. In some cases, we migrated those consumers to the Confluent Go consumer, which also helped us standardize our client configurations across languages. In cases where we couldn’t upgrade the consumers, we added appropriate workarounds and alerting to monitor those use cases.
During these tests we also realized that Zookeeper issues quickly spiraled into larger Kafka issues. So, even though it’s slightly more expensive, we used a separate Zookeeper cluster for each Kafka cluster to reduce the blast radius of a Zookeeper failure.
Chaos testing also helped us understand the operational issues that would arise during a real failure and helped us tune the clusters more.
Self-serve Kafka clusters
There were a lot of cases where our consumer teams would reach out to us with questions or requests about adding or removing capacity to our clusters. One group of questions was about the regular operational issues like capacity planning and another was to understand the health of their pipelines.
In addition, it was tedious to use CLI tools to understand what was happening with Kafka. So, we deployed kafka manager to give everyone visibility into the Kafka cluster metadata like lists of brokers and topics. Kafka Manager also helped us simplify routine operations like creating new topics and increasing the number of partitions for a topic.
To provide operational visibility into the health of the Kafka consumers, we deployed a fork of the kafka offset exporter that exported the consumer offset information as Prometheus metrics. On top of this data, we built a dashboard that provides per-topic, per-consumer and aggregated consumption metrics in real time to our consumers.
To reduce the islands of knowledge, we standardized various runbooks into a single one-page runbook. This helped aggregate all of Kafka knowledge into one place. Also, we consolidated multiple Kafka dashboards into a single global dashboard for all of our Kafka clusters.
Together, these self-serve tools helped our customers better understand the data while reducing the operational overhead for the team. These tools have also helped us improve our security posture by minimizing the need to SSH into the Kafka brokers.
Upgrading the Kafka cluster
To upgrade the Kafka cluster, we decided not to do in-place cluster upgrades for a few reasons. We were not confident that we can ensure zero downtime during the upgrade window, especially when upgrading between several versions at once. In addition, we didn’t have a way to validate that there are no issues with the new cluster, especially when changing the underlying hardware types.
To work around these issues, we instituted a new upgrade policy where we cut over to the new cluster. The cut over process is as follows:
- Start a new cluster
- Run any validation tests using dark traffic on the new cluster
- Stop producing data to the old cluster
- Start producing data to the new cluster
- Turn off the old cluster after the retention window expires
While this strategy has the downside of coordinating cutting over consumers, it’s a standard operating procedure that’s also applicable in other scenarios like moving topics across clusters and testing out new EC2 instance types.
Splitting up the main Kafka cluster
After we invested time in making Kafka self-sustaining and reliable, we bought ourselves precious time to work on other highly impactful features, like tracing. However, even with all the work we’ve put in, there still comes a time when a system has reached a point where assumptions and capacity need to be revisited.
We approached this point in early 2021. Our single cluster of 90 brokers was reaching its tipping point on network throughput, capping out at 40,000 pps. This network saturation was causing downstream pipelines to fall behind as Kafka struggled to keep up with consumers during normal workload, much less handle large spikes in traffic. Our developers who relied on the logging pipeline to debug problems were affected by Kafka network saturation on a daily basis.
In order to shed load from the main Kafka cluster, we leveraged our tools and automation to split large topics off onto their own smaller, more performant clusters (upgrading from older d2 instances to modern nitro-enabled d3en instances). Comparing similar workloads between the two clusters, the newer cluster is able to achieve similar performance (per 1,000 pps) on 20 brokers, resulting in roughly a 2.5x improvement in efficiency.
After moving three of the largest topics off the main cluster, we saw immediate relief on the cluster. Here are some graphs we captured at the time to illustrate the impact of the work.
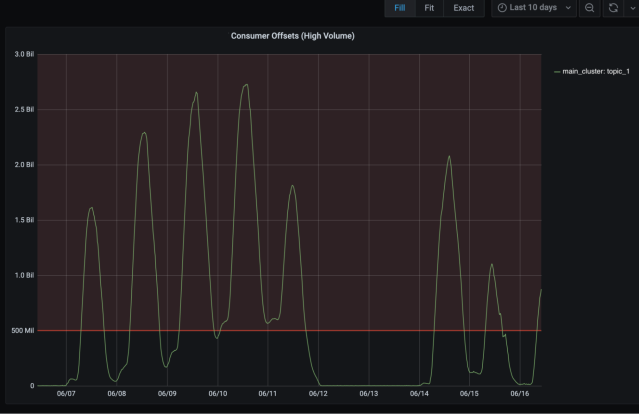
These daily spikes represent the consumer offset lag from one of the largest topics. Any time the offset lagged beyond 500 million, we fell out of our SLA for log freshness.
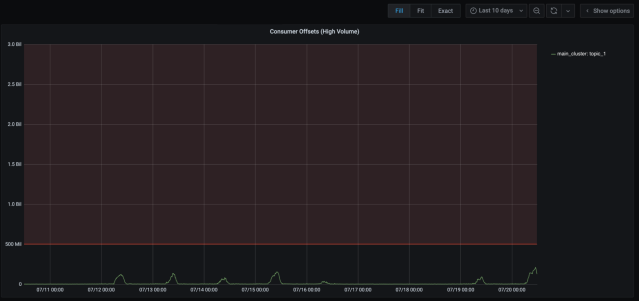
After the topic migration completed, the consumer offset lag improved tremendously. We went from roughly 1.5 hours of log latency in the worst case to 3-4 mins in the worst case. Also, our on-call volume for the logging pipeline went from 71 alerts in a month to 9 alerts in the next month. Quite an improvement!
A smaller dedicated Kafka cluster is also easier to manage since all the cluster management operations finish much faster, and there are fewer noisy neighbor problems.
Conclusion
It’s possible to run a self-healing Kafka cluster at scale using open source components like Cruise Control, Kafka Manager, Chef, and Terraform. In addition, using standard SRE principles and proper tooling like Kafka Manager and Kafka offset exporter, it’s possible to make Kafka reliable, self-serve and self-driving.
We’ve benefited tremendously from the Kafka configs of others. In the spirit of paying it forward, you can find our Kafka config here.
Slack has been running this architecture for the last few years successfully. Going forward, Kafka will play an even more crucial role at Slack, as it is part of the new Change Data Capture (CDC) project. The new CDC capabilities will support caching needs for Slack’s Permission Service, which is used to authorize actions in Slack and will also enable near real-time updates to our Data Warehouse. To that end, we have formed a new Data Streaming team at Slack to handle all the current and future Kafka use cases. The new Data Streaming team will maintain and support all Kafka clusters at Slack. The team will also be responsible for building standardized libraries and tooling related to Kafka, and will work on making further improvements to the current Kafka operations and efficiency.
We are aggressively hiring for this team. Come help us make Kafka awesome at Slack.
Check out the following job postings and apply today!
Sr. Software Engineer: Data Streaming, Core Infra – Slack (US)
Sr. Software Engineer: Data Streaming, Core Infra – Slack (Canada)