You might have used Chrome’s Developer Tools to profile your JavaScript to improve performance or find bottlenecks. DevTools is fantastic, but there’s a lot of potentially useful information that the performance panel doesn’t capture. Enter Chrome Tracing: a tool that’s built into Chrome (and Electron) that can collect a huge variety of detailed performance data. At Slack, we use Chrome Tracing to diagnose complex performance issues, and hopefully after reading this, you’ll be able to as well.
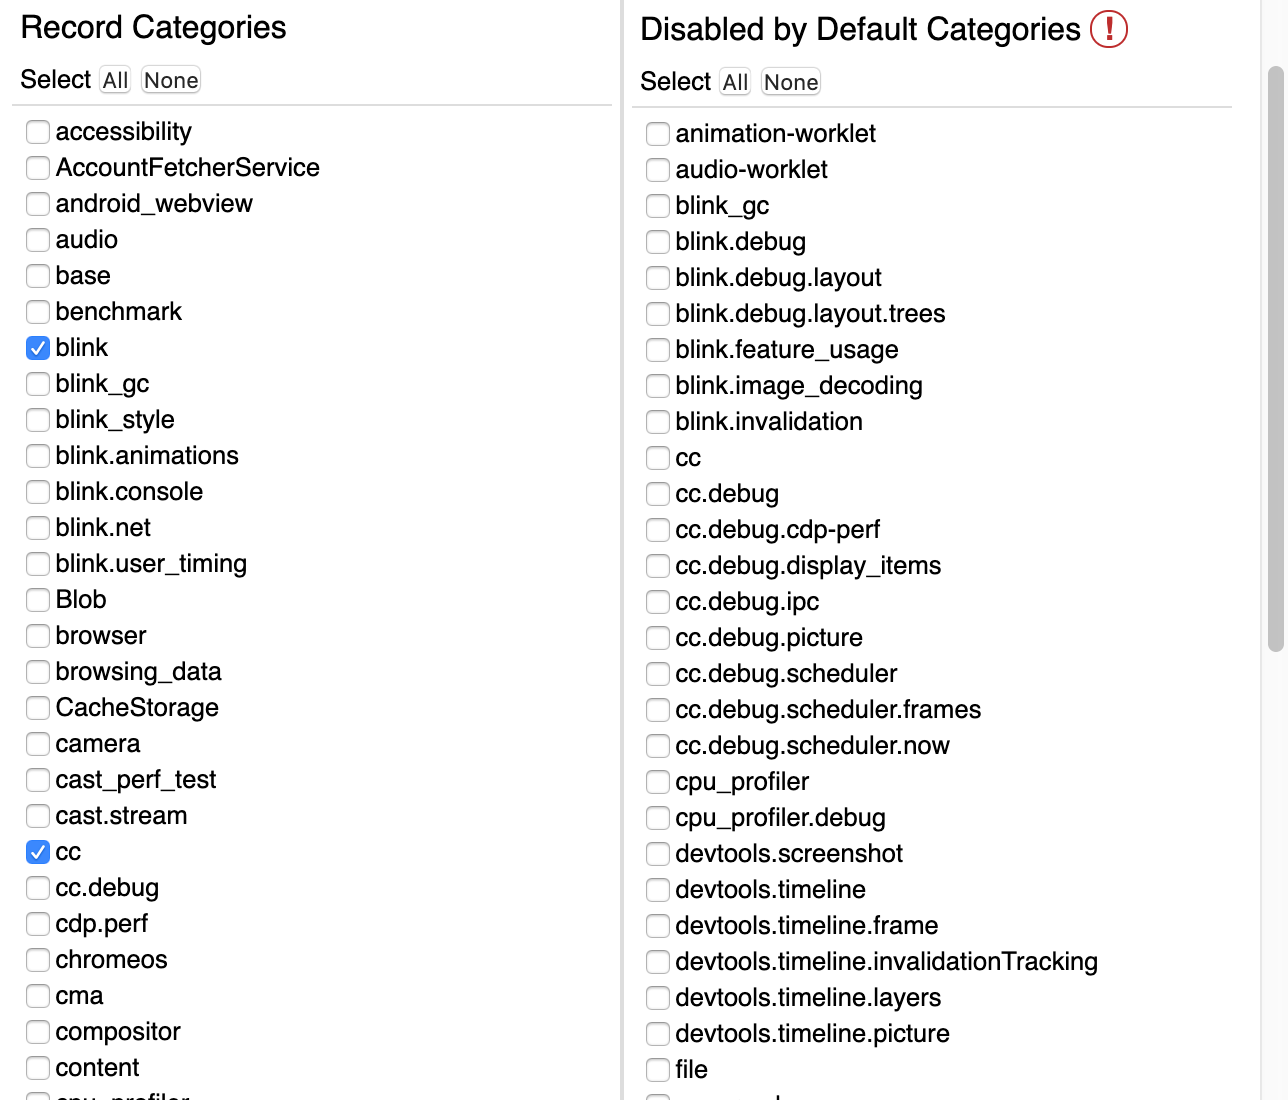
Chrome Tracing consists of two important parts: first, a system for collecting performance-relevant information from the browser itself; and second, a tool for inspecting and analyzing that information. You can try it out for yourself right now by opening chrome://tracing in Chrome. Go ahead and click ‘Record’, select a category (or leave the default ‘Web Developer’ option selected), do something in Chrome, then come back to the tracing tab and click ‘Stop’.
Once your recording is complete and the data is loaded, you’ll be greeted by the delightfully candy-colored analysis interface.
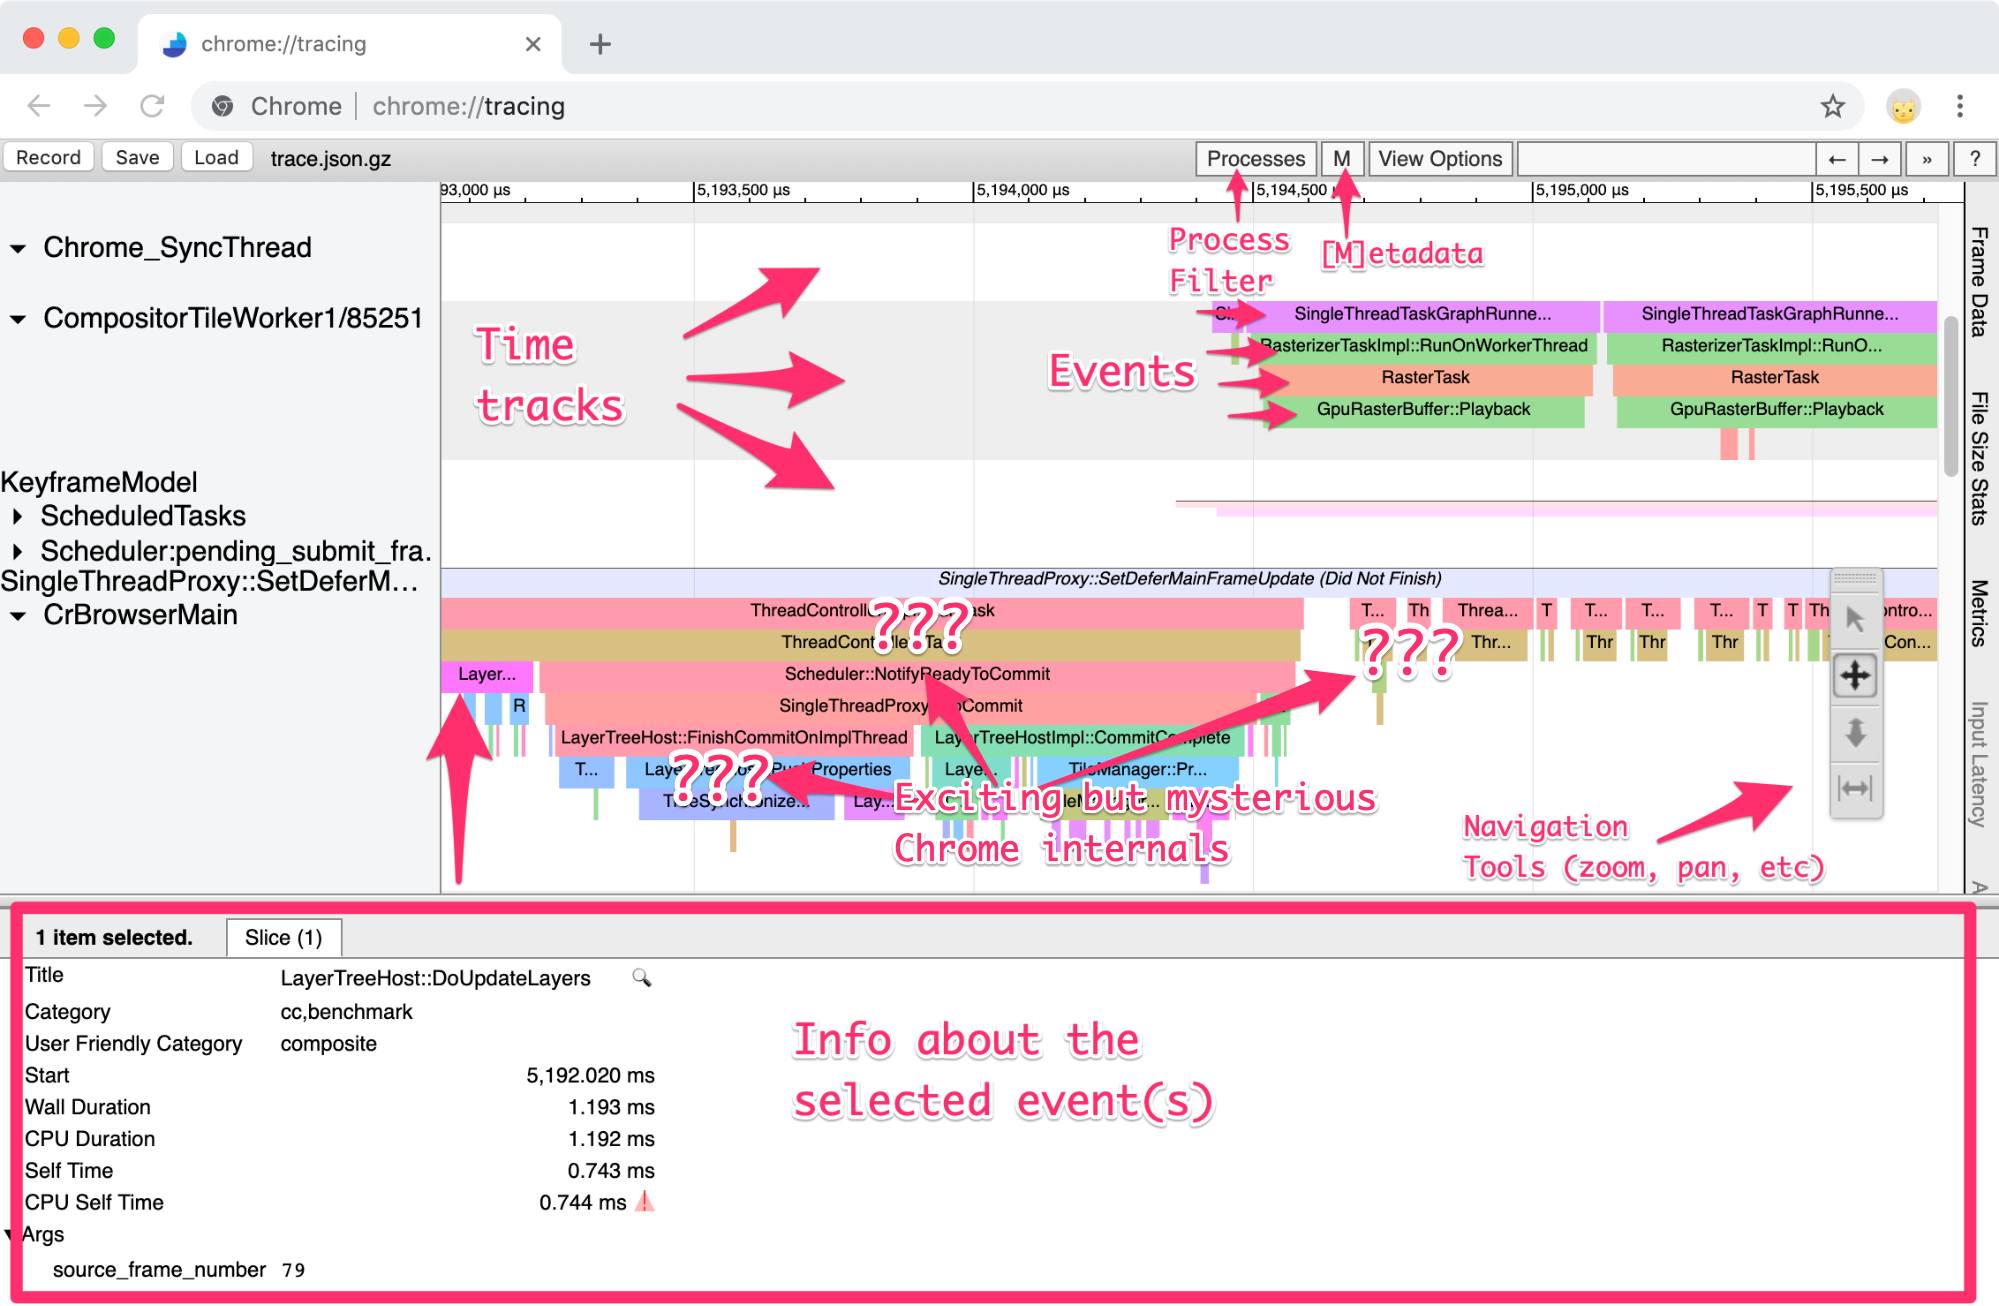
If you click the ‘Save’ button in the top-left, you’ll get a file that you can open up in your favorite text editor — since it’s just JSON. Chrome Tracing can fill this file with all sorts of useful information, from sampled stack traces of JavaScript code to network logging data and even screenshots of your page as it’s being (re-)rendered. But by far the most common kind of data in here is produced by specifically annotated TRACE_EVENT code in Chromium. These aren’t exactly stack traces — they’re performance-relevant events that Chromium developers have identified and annotated by hand. In fact, if you click on the magnifying glass to the right of the event title in the info panel, you’ll be taken to the point in Chromium’s source code where that annotation is defined. For example, here’s the source for the LayerTreeHost::DoUpdateLayers annotation.
When you take into account all the factors that can have an effect on your app’s performance — OS version, CPU, GPU, memory, disk speed, network conditions, other currently running software, and so on— it turns out every desktop environment is as unique as a snowflake. It’s often impossible to exactly replicate a user’s environment to reproduce an issue they might be seeing. When Slack receives a report of a performance issue in its desktop app, we ask the user to trigger a special command that collects a performance trace through the Chrome Tracing system (using the contentTracing API in Electron). With the user’s permission, the trace is securely uploaded to Slack’s servers, where engineers can inspect the trace and hopefully track down the underlying problem. When we’ve completed our review, we delete the trace data.
You can only change what you can perceive. Without tools to observe the world with which we interact, we are powerless to change it.
DevTools should always be your first port of call for understanding and debugging a performance issue — but sometimes it doesn’t provide the answers you were looking for. Chrome Tracing lets you record a much wider array of performance-relevant data about the browser, so it can be helpful when tracking down a performance issue that isn’t strictly JavaScript-related; for instance, GPU issues or cases where one process is waiting on another process. As an example, in Electron apps, a common source of performance issues is over-eager communication (especially synchronous IPC) between the main and renderer processes.
It’s possible to collect trace data programmatically in Electron via the contentTracing API. The contentTracing API lets you specify what categories of tracing data you want recorded — the categories that you can pass to the API are the same ones that are listed in the chrome://tracing UI (the ones in the ‘disabled by default’ column are prefixed with disabled-by-default-, so e.g. if you want to record v8 sample data, you’ll need to specify disabled-by-default-v8.cpu_profiler). If you don’t specify what categories to include, Electron will record everything that’s not disabled by default, which can be a useful way to find out what categories of data you care about — you can click on an event in the tracing UI to see what category it belongs to.
Here’s an example of setting up a trace that records all the default tracing categories, and additionally records V8 sampling data in the renderer:
const {contentTracing} = require('electron')
contentTracing.startRecording({
  included_categories: [
    '*',
    'disabled-by-default-v8.cpu_profiler',
    'disabled-by-default-v8.cpu_profiler.hires',
  ],
  excluded_categories: [],
})

setTimeout(async () => {
  await contentTracing.stopRecording(`${__dirname}/trace.json`)
}, 10000)
To demonstrate what this looks like, I’ve built a simple test app that simulates something that might be hard to debug with the standard DevTools trace. In the test app, the renderer process delegates some CPU-intensive work to the browser process. In a real app, there are lots of reasons you might do something similar: for instance, spell-checking can be quite memory intensive, so you might want to load up the spell-checking dictionary just once in the main process, and have all renderer processes delegate the work of actually checking spelling to the main process. In this test app, though, we just busy-wait for a second.
I built this example with Electron Fiddle, which is a great way to test out quick examples. Go ahead and install Fiddle, and when you’re done, load up the example work-doing app by pasting the Gist URL in the Load Fiddle box.
Try it yourself: first, open up DevTools with Cmd+Opt+I (or Ctrl+Shift+I). Switch to the ‘performance’ tab, start a recording in DevTools, and press the ‘do work’ button. Stop the recording and inspect the resulting trace. What’s using up the CPU?
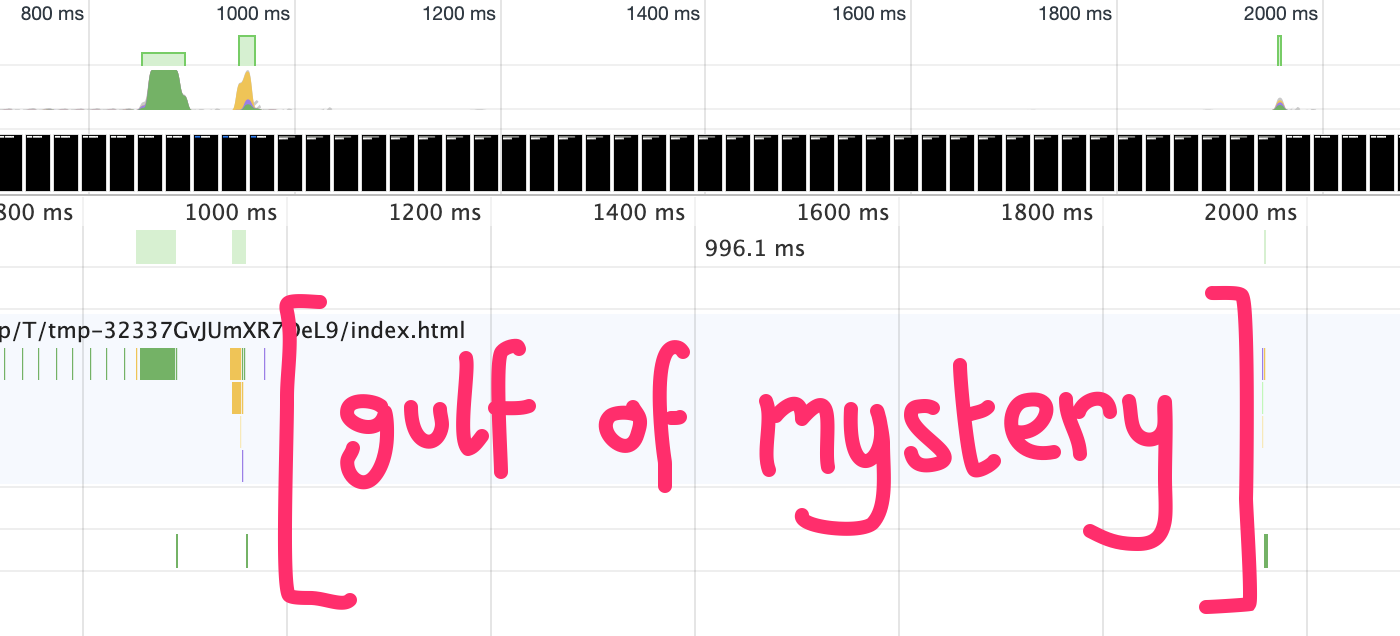
It’s hard to say, because DevTools just shows a big gap. You could maybe try to guess what’s happening here, but it’s much easier to use Chrome Tracing.
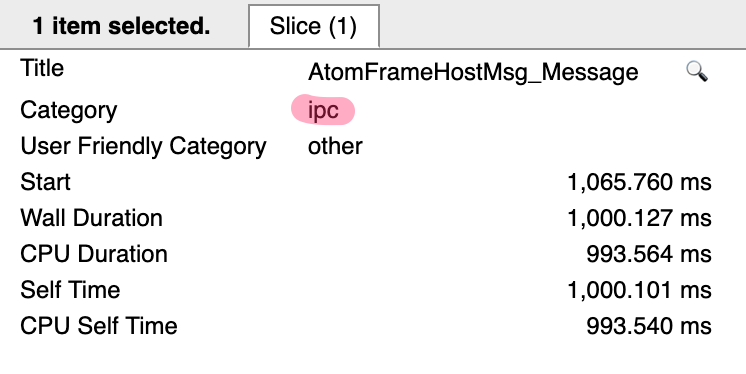
Try tracing this again, but this time, use the ‘start recording’ button in the example app instead of DevTools. This will trigger Electron’s contentTracing API. Once the app is recording, click the ‘do work’ button, and when it’s done, click ‘stop recording’. The folder containing the resulting trace.json file will open (which is accomplished by Electron’s shell.openItem API). Open chrome://tracing in a Chrome tab, and drag that trace.json file into the chrome://tracing window. You’ll see something that looks like this:
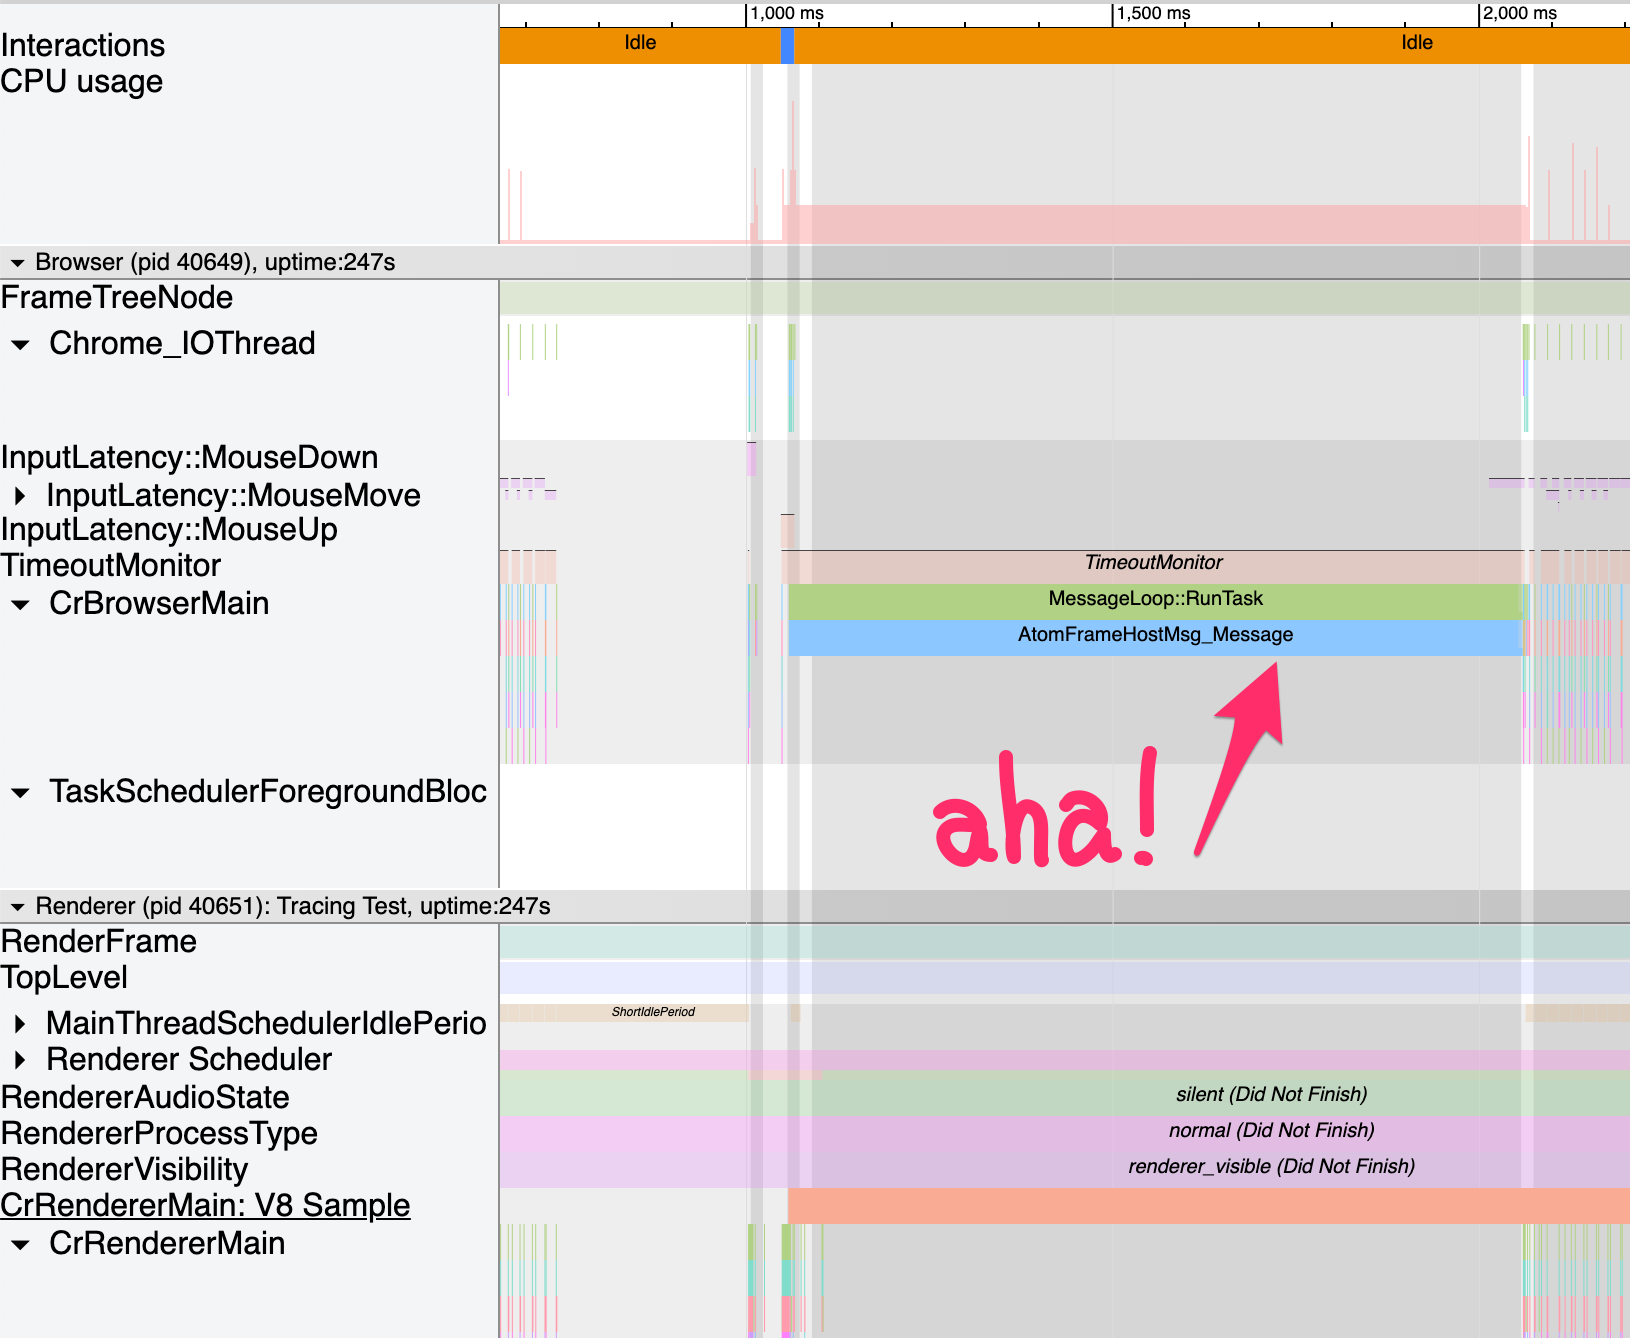
The AtomFrameHostMsg_Message event tells us that the main process is processing an IPC message, in this case for about 1,000 ms. Unfortunately, Electron doesn’t currently support sampling V8 stack traces in the main process, though there is an issue tracking the feature. Often, though, just the information that the main process is handling an IPC event is enough to figure out what’s going on.
The performance panel in DevTools uses the same infrastructure as Chrome Tracing under the hood to collect the information it displays. The file formats are the same — you can save a profile from DevTools and open it in chrome://tracing and vice-versa. When you record a performance profile in DevTools, it signals the Chrome Tracing infrastructure to begin recording with a predefined set of categories.
The Chrome Tracing API is fantastically useful for tracking down performance issues in Slack’s desktop application, but not all of Slack’s users use our Electron app. This raises an obvious question: how can we go about debugging performance issues on users’ machines in the browser?
There’s an exciting new API that’s being worked on right now by the WICG which would allow JavaScript to self-profile. You can read up on the current proposal here, but the gist of it is that you would be able to start a ‘profiler’, specifying a sampling frequency and other options, and when it’s done you’ll receive a blob of performance information that you can relay back to the server for later analysis.
Chrome Tracing is a powerful tool for diagnosing and understanding complex performance issues in web apps and Electron apps. I’ve only scratched the surface of what it can do here — it can record screenshots and DOM trees, for instance! — and there’s a lot more info on the Chromium developer site if you want to get deeper into the capabilities of the system. But you have everything you need to get started now.
If working on Electron, building desktop applications with a mix of C++ and JavaScript, and optimizing web apps are things you find interesting, you might enjoy working with us at Slack!


