By Laura Nolan, with contributions from Glen D. Sanford, Jamie Scheinblum, and Chris Sullivan.
Assessing conditions
Slack experienced a major incident on February 22 this year, during which time many users were unable to connect to Slack, including the author — which certainly made my role as Incident Commander more challenging!
This incident was a textbook example of complex systems failure: it had a number of contributing factors and part of the incident involved a cascading failure scenario.
Just after 6 a.m. Pacific Time, a number of things happened almost simultaneously: we began to receive user tickets about problems connecting to Slack, some internal users experienced problems using Slack, and a number of our engineering teams received pages or alerts about problems.
When a user begins a new Slack session (after restarting their client or being disconnected from the network for some time), the Slack client performs a process called booting, which is described in Mark Christian’s blog post Getting to Slack faster with incremental boot. During the client boot process, data such as channel listings, user and team preferences, and most recent conversations is fetched from Slack’s servers and cached on the client. Slack isn’t usable until your client is booted, and if Slack can’t boot, you get an error page.
Assessing conditions at the beginning of the incident, we found that we were seeing more load than usual on parts of our database system. Slack stores its data in Vitess, a horizontal scaling system for MySQL (see Scaling Datastores at Slack with Vitess). Vitess supports keyspaces, which are logical databases. Different tables within a keyspace may be sharded by different keys. Slack uses multiple keyspaces, which gives us the ability to query data efficiently, provides isolation between different query workloads, and allows us to scale our datastores horizontally. During this incident one of our Vitess keyspaces (a keyspace containing channel membership which is sharded by user) became severely overloaded.
What was not obvious early on was why we were seeing so much database load on this keyspace and how we might get to a normal serving state. Our response to this incident involved a number of responders who were subject-matter experts in various aspects of Slack’s infrastructure. Some responders began to work on investigating the reasons for the unusual load pattern that we were seeing, while others began to work on mitigations.
Throttling load to Slack
A significant element of the datastore load appeared to be from a query that listed Group Direct Message (GDM) conversations by user. This operation is fronted by our cache tier, so the high query load seemed to indicate something was wrong with our caches.
The most affected Slack API operation during the incident was the client boot operation. Because of the overloaded database tier, client boot requests were taking much longer than usual and often failing. These slow requests were causing resource exhaustion in our database tier and were preventing other requests — from users who had booted clients — from succeeding. Therefore, we made a decision to throttle client boot requests.
We knew that this throttling would mean that users without booted clients would be unlikely to be able to connect to Slack — but the tradeoff was that users who did have booted clients would likely see relatively normal service restored. Furthermore, reducing load would reduce the number of database queries timing out, and thus allow the cache to fill.
We applied a restrictive throttle and it worked, to some degree. The number of errors we were servicing was reduced, and users with booted clients began to see more normal Slack performance. This was still not an ideal situation, but it was the best mitigation we had available at the time.
We then attempted to increase the number of client boot operations permitted. However, our initial attempt increased the limit by too much. Database load increased again beyond sustainable limits and we observed the number of failed requests to Slack rising. We were forced to reduce the client boot rate limit once more, and then to increase by smaller increments.
What triggered the incident?
What caused us to go from a stable serving state to a state of overload? The answer turned out to lie in complex interactions between our application, the Vitess datastores, caching system, and our service discovery system.
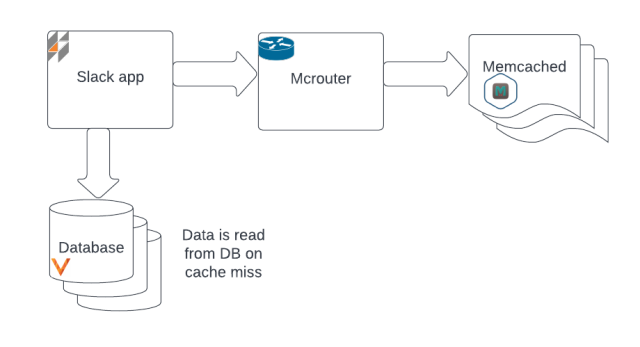
Requests to Slack are served by our web application and a variety of other services. We use Memcached as our caching tier, in order to provide low-latency access to frequently-used data. A component called Mcrouter allows us to scale our cache fleet horizontally. Given a configuration file which provides an ordered list of healthy memcached hosts, Mcrouter uses consistent hashing to route cache requests. If data isn’t in the cache, or if an update operation occurs, the Slack application reads it from the Vitess datastore and then inserts the data into Memcached.
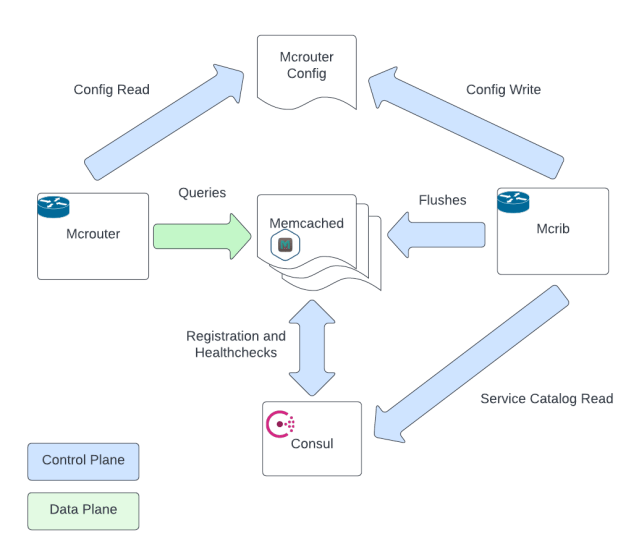
We also run a control plane for the cache tier, called Mcrib. Mcrib’s role is to generate up-to-date Mcrouter configurations. It watches Consul, our service discovery system. When memcached instances become unavailable (according to the Consul service catalog), Mcrib assigns a spare instance to replace it. If old memcached instances rejoin after a period of unavailability then they are flushed before being promoted to active, to avoid inconsistent data. Because an empty cache slot causes both increased latency and pressure on backing datastores as it fills, Mcrib is designed to maintain a stable cache ring and flush only when necessary.
The Mcrib component is a relatively new piece of software. Prior to Mcrib, we used a distributed locking mechanism based on Consul locks to generate the Mcrouter hash ring. The old distributed locking mechanism had scaling issues; all memcached instances that did not have an assigned part of the hash ring continuously attempted to gain a lock, which could cause contention. Mcrib solved that issue very effectively.
In the lead-up to this incident, we had been performing maintenance on our Consul agent fleet. We were upgrading the Consul agent, which runs on each instance, participating in the Serf gossip protocol which Consul uses for service discovery. This portion of the Consul rollout involved a percentage-based rollout (PBR) step that upgraded the Consul binary on the host, followed by a sequential (and fairly slow) restart of the agent on the hosts. This is intended to avoid a coordinated wave of restarts which might destabilize a service. When a Consul agent shuts down, it deregisters the node (and the services on the node) from the service catalog, and re-registers them when it starts up again. When the agent restart occurs on a memcached node, the node that leaves the service catalog gets replaced by Mcrib. The new cache node will be empty.
The PBR step on February 22 updated Consul on 25% of the fleet. It followed two previous 25% steps the prior week, both of which had occurred without any incident. However, on February 22, we hit a tipping point and entered a cascading failure scenario as we hit peak traffic for the day. As cache nodes were removed sequentially from the fleet, Mcrib continued to update the mcrouter configuration, promoting spare nodes to serving state and flushing nodes that left and rejoined. This caused the cache hit rate to drop.
Scatter queries and datastore load
One of the things that the client fetches during the boot process is the list of other users in the GDMs that you are in. We were querying this from a Vitess keyspace containing channel information that is sharded by user. The sharding scheme means that it is efficient to find the set of channels that any given user is a member of. However, it is quite inefficient to find the set of users that are members of a particular GDM from this sharded-by-user table, because you have to query every shard in the datastore. When the sharding key is not part of the query, Vitess allows for a feature called a “scatter query” which sends the query to every shard in the keyspace. In a low-query volume case, this can be a reasonable way to make the data available to the application. An alternative is to dual-write the data under a different sharding strategy. We also have a keyspace that has membership of a channel sharded by channel, which would have been more efficient for this query. However, the sharded-by-user keyspace was used because it contained needed columns that were not present in the sharded-by-channel table.
Normally the GDM membership data is cached by channel ID, which means that the client boot performance is acceptable, despite the inefficient underlying query. Furthermore, membership of GDMs is immutable under the current application requirements, so there is a long cache TTL, and therefore the data is almost always available via the cache.
However, since the data is sharded by user ID, even one channel missing from cache meant the application had to successfully run a query on every shard. With a significant portion of the cache unavailable, nearly all users needed to successfully query every shard of the keyspace. These queries are fast, but during this incident we simply had too many of them. The database was overwhelmed as the read load increased superlinearly in relation to the percentage of cache misses. Most queries to the channel membership-sharded-by-user Vitess tables were timing out, which meant that the cache could not be filled.
Cascading failure in the cache and datastore tiers
Early in the incident we had paused the Consul agent restart operation that had triggered the problem, even though at that point we had not suspected that the Consul restarts were related to the incident. However, by then it didn’t make a difference: we were in a cascading failure state, and systems in a cascading failure state do not normally return to a stable state without a significant reduction in load or increase in capacity (which normally is a result of operator intervention).
In a normal stable state, cache hit rates are high, database load is healthy, and there is no barrier to reading data to fill the cache to maintain the cache hit rate.
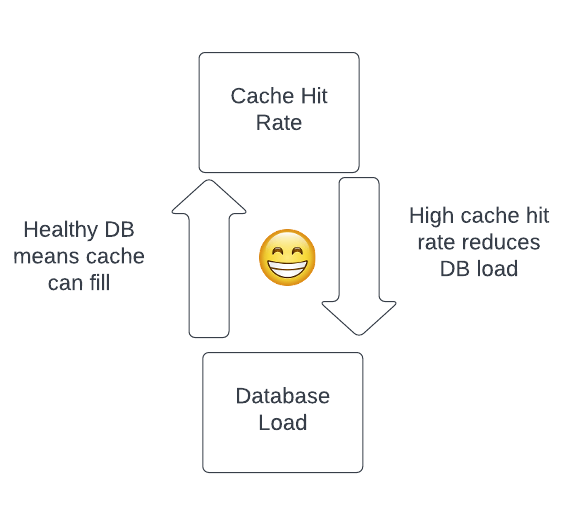
However, when something destabilizes the system — in this case, the Consul agent restarts combined with the problematic query — we can pass a tipping point and encounter the inverse relationship, where lower cache hit rates result in high database load and problems filling the cache.
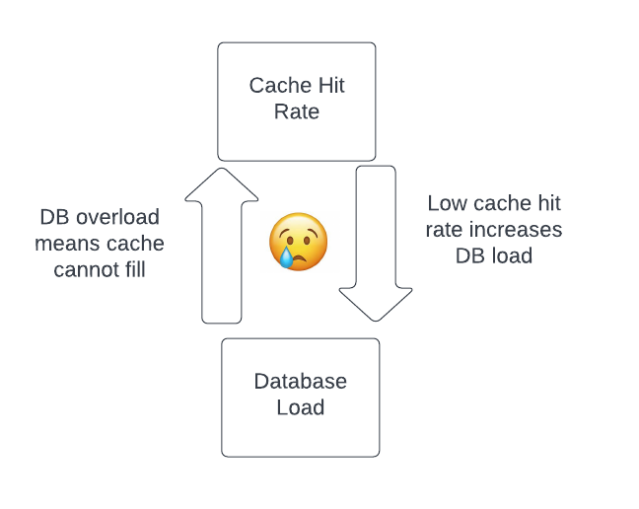
Client retries are often a contributor to cascading failures, and this scenario was no exception. Clients have limited information about the state of the overall system. When a client request fails or times out, the client does not know whether it was a local or transient event such as a network failure or local hot-spotting, or whether there is ongoing global overload. For transient failures, prompt retrying is the best approach, as it avoids user impact. However, when the whole system is in overload, retries increase load and make recovery less likely, so clients should ideally avoid sending requests until the system has recovered. Slack’s clients use retries with exponentially increasing backoff periods and jitter, to reduce the impact of retries in an overload situation. However, automated retries still contributed to the load on the system.
Once the system is in either a healthy state or a cascading failure state it will tend to stay there, unless there is an external intervention that changes the system (see Bronson, Charapko, Aghayev, and Zhu’s HotOS 2021 paper ‘Metastable States in Distributed Systems’).
In this case, we did several things to recover. We reduced traffic to the datastores via the client boot throttle. The inefficient query was modified to read from Vitess only the data that was missing from memcached, rather than reading from every shard on each miss. Because the GDM data is immutable and thus can tolerate staleness, the query was also updated to read from replicas as well as Vitess primaries. The caches began to refill and hit-rates increased, reducing load on the database. We were able to slowly increase the client boot rate limit back to normal traffic levels while maximizing database goodput, until we had fully restored service.
Learnings
We see familiar patterns here which often arise in incidents: performance bottlenecks, cascading failures, dependency on a warm cache, and changes as triggering events. Reading an incident narrative such as this one can make the course of events seem quite predictable, even inevitable. However, predictions are much easier in retrospect, and it is much easier to make broad-brush statements about the sorts of incidents that may occur than to pinpoint every specific sequence of events or problems that can lead to a cascading failure. The incident on February 22 involved interactions across several system boundaries, and some of these systems had recently been changed. Complexity and change are inevitable in large software systems, but inevitably create risk of unpredictable behavior.
Nevertheless, this incident, while truly painful, provided some important learning opportunities. The interactions between Consul and the caching architecture are now much more broadly understood, and we have already made changes in the process for performing Consul rollouts that should mean we do not trigger this failure mode again during upgrades.
It’s interesting to note that the new Mcrib component contributed to the incident not by being incorrect or inefficient — quite the opposite. Mcrib was faster and more efficient at detecting downed memcached instances and repairing the cache configuration than the previous scheme had been. Mcrib’s efficiency increased the churn in the cache tier and contributed to the severity of the incident. Mcrib is objectively a better system for generating memcached configurations — but its efficiency made the broader system behave in a less safe way.
The incident has also highlighted some other risks. A brief network outage or partition affecting the cache nodes might trigger the same kind of cascading failure scenario as the Consul agent restarts did (or worse, as it would be more coordinated). However, we are rolling out changes to this part of the Mcrib control loop to avoid this kind of failure.
We have modified the problematic scatter query to read from a table that is sharded by channel. We have also analyzed our other database queries which are fronted by the caching tier to see if there are any other high-volume scatter queries which might pose similar risks. Other more long-term projects are exploring other ways of increasing the resilience of our caching tier.
Often, after I am involved in an incident, I reread Dr. Richard Cook’s short and influential paper ‘How Complex Systems Fail’. On this occasion, it was the fourth of the 18 sections that seemed most relevant:
“Complex systems contain changing mixtures of failures latent within them. The complexity of these systems makes it impossible for them to run without multiple flaws being present. Because these are individually insufficient to cause failure they are regarded as minor factors during operations. Eradication of all latent failures is limited primarily by economic cost but also because it is difficult before the fact to see how such failures might contribute to an accident. The failures change constantly because of changing technology, work organization, and efforts to eradicate failures.”
But all is not lost: what is left in Dr. Cook’s Pandora’s Box of Complex Systems Failure is not hope, but human expertise and adaptability. We at Slack Engineering share this story with you so that we can increase not only our own knowledge about systems failure, but contribute to the broader industry as well. We have learned a lot during our careers from other people’s stories about distributed systems failure, and we hope you can learn something from ours.
Our incredible colleagues in Slack’s Communications and Social Media team put it best on the day: we’re grateful for your patience during the disruption — no two ways about it!
